

It’s the inevitable gut reaction that we all have. If you see massive debit-based puts in the options flow screener like we just did for financial giant Citigroup (C), acute feelings of pessimism rise to the forefront. However, the derivatives market can be tricky because you’re never really sure about underlying intentions. In this case, the unusual options activity very well might be bullish for C stock in a roundabout way.
On Monday, Citigroup’s options flow readout — which focuses on big block transactions likely placed by institutional investors — showed that net trade sentiment slipped to nearly $3.6 million below parity. To be fair, sentiment constantly fluctuates in the derivatives arena. Plus, it should be noted that last week, sentiment was overwhelmingly positive.
Still, what caught everyone’s attention this time around is that most of the negative flow stemmed from one trade: 2,000 contracts of the $97.50 put expiring Jan. 15, 2027, with the entity (or entities) paying $2.33 million for the privilege.
Now, I’m not about to anthropomorphize these options-related statistics and make wholesale assumptions about the underlying intentions. Still, the nature of the beast suggests that these puts were not really placed with bearish intention in mind but rather as a sort of insurance play against violent volatility.
A couple of clues seem to confirm my suspicions. First, an expiration date more than a year from now suggests downside mitigation over a tactical initiative. Second, the time frame will also likely capture major macro uncertainties, such as election results and credit cycle shifts. Third, the strike price being so close to the market price suggests a classic “insurance put” profile.
Ultimately, you can study the numbers left and right; nobody will ever absolutely know the reason unless the traders in question bother to explain themselves. That’s probably not going to happen so logical inferences are the best that we have.
Leveraging Scientific Methodologies to Trade C Stock
It might not be that much of a stretch to assume that, were it not for the current panic in the market, the aforementioned put options might not have generated much attention. Options flow sentiment turns positive and negative all the time as institutional giants hedge their positions. But because of the broader volatility, unusual puts carry more weight.
That said, what we should truly care about is the data — and the hard numbers tell a fascinating tale for C stock.
As you’ve seen in the past several months, I analyze stocks in a completely different manner than my colleagues. Explaining the process would take ages but in the simplest manner possible, my system involves an adaptation of a Kolmogorov-Markov framework layered with kernel density estimations (KM-KDE), treating price behaviors as a discretized, probabilistic space with real outcomes and distributions.
Essentially, the innovation here is that rather than view price as a singular journey across time, I view it as a collection of hundreds (if not thousands) of trials across a standard interval. The idea is that over enough trials, prices should cluster around certain areas. What’s more, different sequences of trials should yield different behaviors, which can be tracked or analyzed.
To be 100% clear, this process doesn’t guarantee perfect predictability — no system can. What it does, though, is provide a clearer idea of risk-reward profiles.
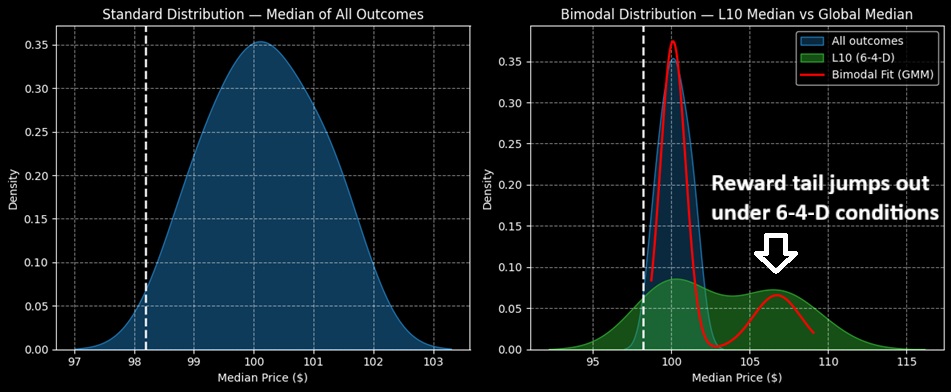
Using the KM-KDE approach mentioned above, the forward 10-week median returns of C stock can be arranged as a distributional curve, with outcomes ranging between $97 and $103.40 (assuming an anchor price of $98.19, Monday’s close). Further, price clustering would likely be predominant at $101.20.
The above assessment aggregates all sequences since January 2019. However, we’re interested in the current behavioral state, where C stock is structured in a 6-4-D formation; that is, in the trailing 10 weeks, Citigroup printed six up weeks, four down weeks, with an overall downward slope.
Under this condition, the expected median range over the next 10 weeks comes out to approximately $92 and $117. Moreover, price clustering would likely be predominant at $100, with secondary clustering occurring at $107.
Letting the Data Guide Us to an Enticing Trade
Using the market intelligence above, the trade that arguably stands out the most for aggressive traders is the 97.50/105.00 bull call spread expiring Jan. 16, 2026. This transaction involves buying the $97.50 call and simultaneously selling the $105 call, for a net debit paid of $351 (the most that can be lost).
Should C stock rise through the second-leg strike ($105) at expiration, the maximum profit is $399, a payout of almost 114%. Breakeven lands at $101.01, which is right about where the primary cluster would be located under 6-4-D conditions. Plus, $105 is well within the distributional reach of the sequence, making the spread an attractive wager.
On the date of publication, Josh Enomoto did not have (either directly or indirectly) positions in any of the securities mentioned in this article. All information and data in this article is solely for informational purposes. For more information please view the Barchart Disclosure Policy here.
More news from Barchart
- Data Science Points to Upside for Citigroup (C) Stock Despite the ‘Insurance’ Bet
- Domino's Pizza Stock is Undervalued Here - Shorting One-Month Put Options Yields 1.67%
- Are These Beaten-Down Bottom 100 Stocks to Buy Ready to Rebound?
- Here Is What Options Traders Expect for NVDA Stock After Nvidia Reports Q3 Results This Week


