

Markets might seem like they turn on headline news, but the fact is, investor sentiment drives the action more often than not. And one of the cleanest ways to see sentiment changing in real time is through candlestick charts, starting from higher timeframes all the way down.
In a recent Market on Close livestream, Senior Market Strategist John Rowland, CMT, explained the anatomy of a bearish engulfing candle on the weekly chart of the Invesco QQQ Trust (QQQ) – the tracking ETF for the benchmark Nasdaq-100 Index ($IUXX). While the chart formation may look subtle at first glance, the implications beneath the surface are important for traders and investors heading into the next few weeks.
While it’s not necessarily a prediction of a QQQ crash, this chart pattern is a signal that the balance between buyers and sellers is shifting as we head into year-end.
Why Weekly Candlesticks Matter More Than Daily Noise
At its core, a candlestick is simply a picture of the battle between buyers and sellers over a specific period of time. The longer the timeframe, the more meaningful that picture becomes.
On a weekly chart, each candle represents five full trading days of emotion, positioning, and decision-making. That’s why weekly opens, highs, lows, and closes often act as major reference points — even on daily and intraday charts.
As John explains, last week’s QQQ candle had several key characteristics that made it stand out.
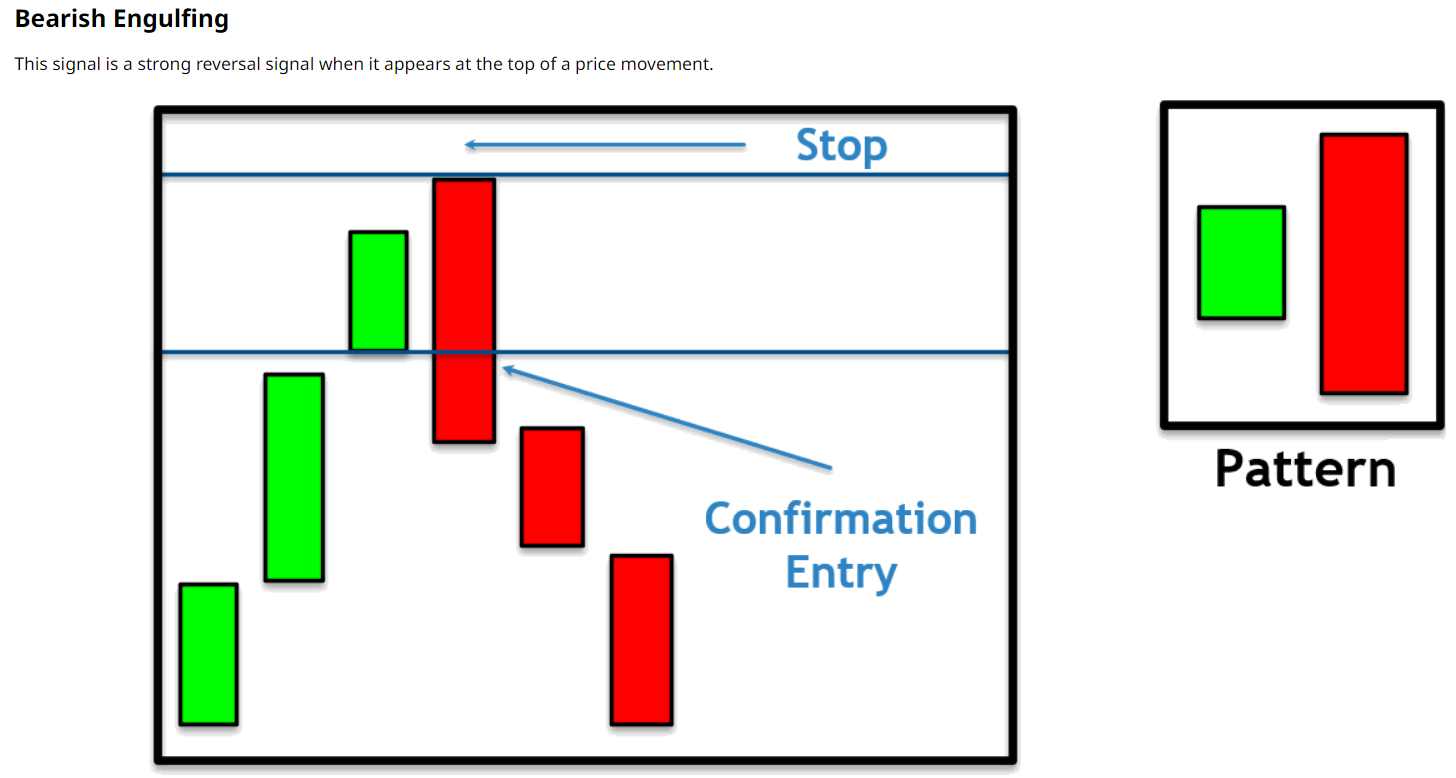
This pattern doesn’t automatically mean something ominous is coming. However, candlestick theory suggests that when a bearish engulfing candle forms, markets often see follow-through for the next 3–5 candles.
How the Daily Chart Confirms the Weekly Pattern
Looking past the weekly chart, one of the most powerful concepts in technical analysis is that higher timeframes influence lower ones.
After the weekly engulfing candle formed, John dropped down to the daily chart and highlighted:
- QQQ opened higher on Monday, but then traded lower
- Price closed below the prior week’s low
- The market printed lower highs and lower lows
That’s the kind of behavior we would expect to see in a downtrend, and it stemmed directly from the weekly sentiment shift.
What’s Next for QQQ Now?
The bearish engulfing candle on QQQ doesn’t signal a crash, but it does signal a shift in control. After months of upside momentum, we saw that sellers finally pushed back on a weekly basis.
This doesn’t mean QQQ is headed straight down from here. However, it does mean:
- Rally attempts may struggle
- Volatility could increase
- Support and resistance levels matter more
Watch this clip to see John explain the candlestick pattern point by point:
- Stream the full Market on Close episode
- Screen for candlestick patterns across stocks and ETFs on Barchart
On the date of publication, Barchart Insights did not have (either directly or indirectly) positions in any of the securities mentioned in this article. All information and data in this article is solely for informational purposes. For more information please view the Barchart Disclosure Policy here.
More news from Barchart
- The Nasdaq-100 ETF Just Flashed a Bearish Chart Signal. Here’s What Happens Next.
- Silver Prices Are Flying. Should You Try to Catch the Rally, or Bet Against It?
- Chip Stocks Are No Longer an Automatic Path to Profits. What the Numbers Say About This Key Semi ETF Now.
- Silver Prices Are Spiking. Here’s Why It Could Be a Buying Opportunity for Gold.


