

Recently, Barchart contributor Will Ashworth brought to the table nine Christmas call options, using the platform’s unusual options activity screener to filter for companies that met a minimum volume-to-open-interest ratio combined with compelling underlying businesses. One of the names that we’re both interested in — though I would argue from different angles — is Robinhood Markets (HOOD).
At first glance, HOOD stock does seem to be a challenging idea for growth-oriented investors. As Ashworth pointed out, Robinhood has witnessed a nearly 230% price appreciation so far this year. Perhaps even more problematic, HOOD trades at about 51 times trailing-12-month earnings. Most experts would likely label the trading app as being priced for perfection.
However, the fundamental argument is that the expanding business contextually makes HOOD stock undervalued. “[Robinhood’s] customer base has grown— 26.8 million funded accounts, 10% higher in Q3 2025 alone — driving significant revenue and profit growth. In the third quarter, revenues increased by 100%, while earnings per share jumped 259% to $0.61. Sequentially, its revenue in the latest quarter was 29% higher than in Q2 2025, while its net income increased by 44% from June 2025,” wrote Ashworth.
Adding to the enthusiasm is Barchart’s Expected Move calculator. For the Feb. 20, 2026, options chain, the implied volatility (IV) that’s integrated into a proprietary Black-Scholes formulation blend spits out a projected swing of 16.11% in either direction relative to the anchor. Nominally, HOOD stock can range between $101.04 and $139.84.
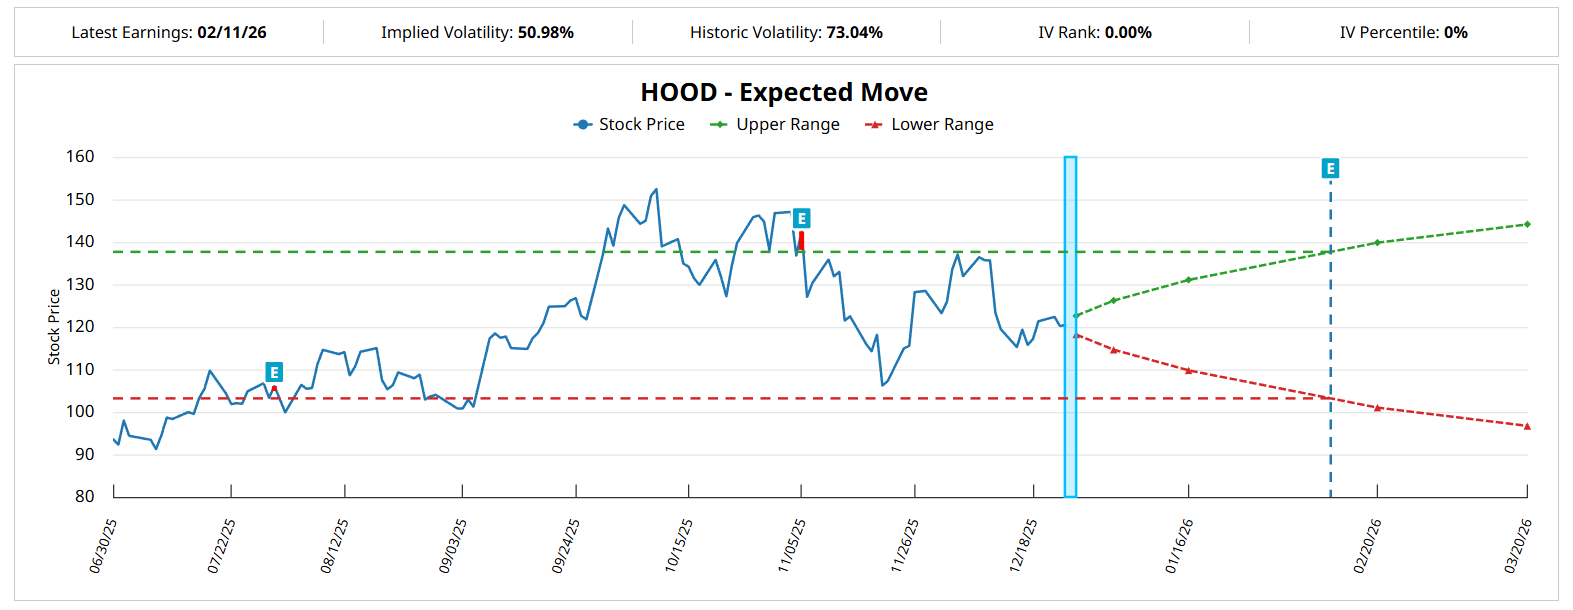
Of course, the expected move represents a dispersion rather than a probabilistic range. That said, given the strengths of the business — along with positive analyst sentiment — the common assumption is that HOOD stock will fall toward the higher end of the aforementioned dispersion.
My proposal is that, with a little framework adjustment, we can narrow the dispersion down to a tighter range.
Identifying the Risk Geometry of HOOD Stock
Back in the end of September this year, HOOD stock traded at a forward earnings multiple of over 69 times. At that point, shares were exchanging hands at over $143. This is another reason why some traders might consider Robinhood to be contextually undervalued. Nevertheless, advanced traders will want to interrogate such claims carefully before making a decision.
Imagine an MLB player who only hits .175 and is subsequently designated for assignment. Rather than meander aimlessly in the minors, he goes to NPB (Nippon Professional Baseball). After a season in Japan, he’s hitting .250 and has improved multiple key performance stats, especially in the clutch. Would this ballplayer be considered undervalued now?
The most intellectually honest answer is “maybe.” However, we cannot assume competitive invariance between MLB and NPB.
Going back to Robinhood, we don’t have a universal benchmark to determine whether HOOD stock is actually undervalued or not. What we can find, though, is probabilistic frequency of behavior based on past recurrences of identical quantitative signals.
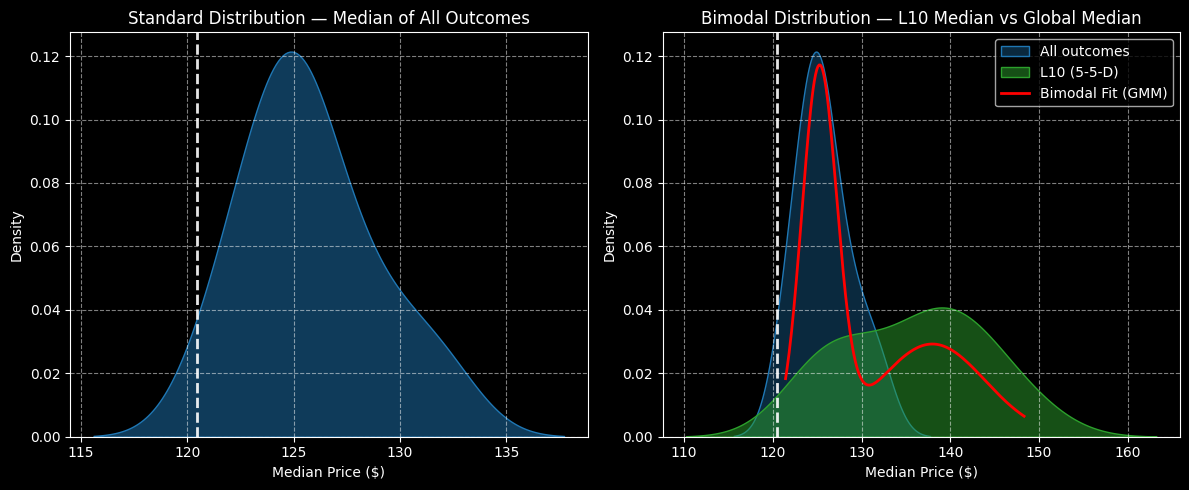
You can refer to my prior work on quant-based research to get a better idea of the underlying mechanics. In this case, HOOD stock in the trailing 10 weeks has printed a 5-5-D sequence; that is, during the aforementioned period, the number of up and down weeks was evenly split, but with a net negative slope.
Under this setup, the forward 10-week returns of HOOD stock will typically range between $110 and $160, with price clustering likely to be predominant at $140 (assuming an anchor price or starting point of $120.44, Wednesday’s close). In other words, $140 represents the most frequent price that is traversed over the next 10 weeks when the 4-6-U sequence flashes.
It doesn’t mean that HOOD stock can’t hit $150 or higher. It’s just that these price zones over the fixed-time distribution are less likely to be traversed on a sustained basis. Therefore, by calculating risk geometry, we have a good idea how much we can push — and where we should back off.
Probability Decay Justifies a Strategic Decision
Exposure to different options strategies requires different types of conviction. In the case of a straight debit call — especially one that features an elevated out-of-money (OTM) strike price — the conviction is centered on tail acceleration. Going back to Ashworth’s article, the argument is that the $1 ask is worth speculating on the off-chance that HOOD stock enters an explosive sentiment cycle prior to expiration.

However, by calculating risk geometry, we may have directional conviction. Again, based on the empirical data collected through a hierarchical framework, the most likely outcome over the next 10 weeks is for HOOD stock to reach $140. So, we’re willing to be buyers of probabilistic premium up to $140. But beyond $140, we’re actually inclined to be sellers.
Why? Simply, probability decay accelerates sharply from that point forward. For example, between $140 and $150, probability density drops by 64.44%. From $150 to $160, density plunges even more by 96.53%. Based on statistical data, there’s no point in bullish exposure to these price points over the next 10 weeks simply due to their improbability of materialization.
So, the solution for those who lack outright tail conviction but have directional conviction is to consider the 135/140 bull call spread expiring Feb. 20, 2026. It’s not as exciting as a straight call because of the spread’s capped-risk, capped-reward nature. Still, if HOOD stock rises through the $140 strike at expiration — which is realistic — the payout is 212.5%.
On the date of publication, Josh Enomoto did not have (either directly or indirectly) positions in any of the securities mentioned in this article. All information and data in this article is solely for informational purposes. For more information please view the Barchart Disclosure Policy here.
More news from Barchart
- Cisco Systems Stock Is Treading Water - How to Use Puts and Calls to Play CSCO
- Here’s a Smart Way to Trade Robinhood (HOOD) Stock Without Going into Lottery Mode
- Have a MERRY Christmas With These 9 Unusually Active Options
- Super Micro Computer Stock Tumbles, But Investors are Piling into Its Call Options - Time to Buy SMCI?


