

Microsoft Corp (MSFT) reported strong operating cash flow (+60% YoY) for its fiscal Q2 ending Dec. 31, 2025. However, free cash flow fell 9.3% YoY and was down 77% QoQ. This was mainly due to a massive increase in AI-related capex. But, there could be reasons why MSFT's decline has been overdone.
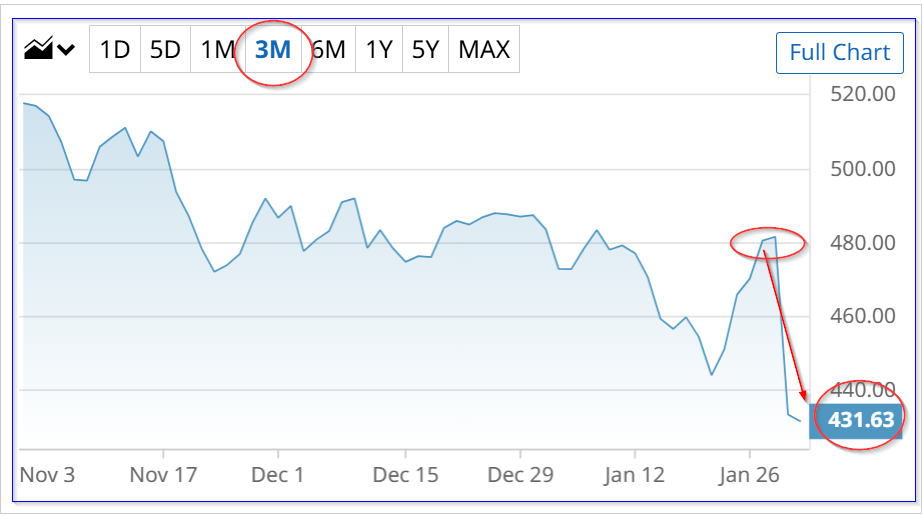
MSFT is at $430.13, down over 10.4% from $481.63, where it closed on Jan. 28. Is this where MSFT will stay?
Why Microsoft's Capex Spending Hike and FCF Might Improve
Here are some reasons why capex could fall, and free cash flow (FCF) could rise going forward. First, management said they expect capital expenditures "to decline on a sequential basis due to normal variability” in cloud spending and finance leases.
Second, this increase in capex spending could be a normal seasonal increase due to annual purchases in hardware by Microsoft's clients. For example, last year, capex spending spiked in fiscal Q2 as well, and FCF fell as a result. But the next quarter, FCF rose again after capex tapered off.
Here is what happened in the latest quarter, based on page 21 of Microsoft's quarterly deck:
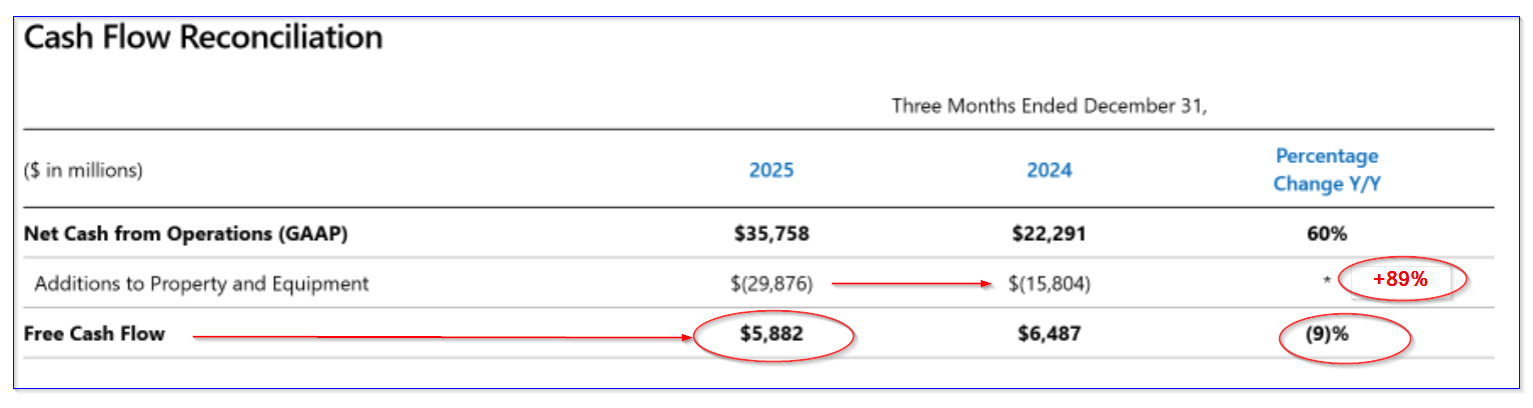
It shows that last year, FCF was only 9% lower, but this was after capex rose 89% YoY and operating cash flow was up 60% YoY.
However, Operating Cash Flow (OCF) fell from $45 billion in Q1 to $35.758 billion (a -20.6% QoQ decline), and the prior year it was worse - a 34.8% decline from $34.18 billion to $22.91 billion (according to quarterly stats from Stock Analysis).
Moreover, capex spending in both periods rose. However, the 89% YoY increase was highly influenced by the QoQ increase from $19.394 billion in Q1 to $29.876 billion in Q1 (a +48.9% rise QoQ). Last year, the Q2 capex increase was just 5.9% on a sequential QoQ basis.
The bottom line is investors don't need to expect another quarterly 50% increase in capex spending. Moreover, operating cash flow (OCF) is likely to continue to rise significantly.
As a result, it's not unreasonable to expect a more than just a 10% decline in Microsoft's FCF margin. Here's why.
FCF Margin Projections
Despite the 20% quarterly dip in OCF to $35.758 billion and the spike in capex spending (up 20.39% sequentially over the last year compared to last quarter), Microsoft's FCF margin (i.e., FCF as a percent of revenue) was still strong over the last year.
For example, the FCF margin was 25.34% of sales over the trailing 12 months (TTM) ending Q12. That was down only slightly from the TTM FCF margin of 26.55% in Q1 and 26.75% a year ago, according to Stock Analysis.
For example, over the last year, FCF was $77.412 billion, representing 25.34% of the TTM revenue of $305.453 billion.
Let's assume that quarterly capex rises 20% YoY to $100 billion from $83 billion over the last 12 months (averaging $25 billion each quarter) over the next 12 months (NTM).
In addition, analysts now expect revenue to rise to between $327.89 billion in fiscal 2026 (ending June 30) and $377.63 billion next fiscal year. That implies NTM revenue of $353 billion. That is 15.6% higher than the LTM period revenue, and as a result, we might expect OCF to rise 16% to $186 billion, up from $160.5 billion over the last year.
Therefore, FCF could be as follows:
$186b OCF - $100 billion capex = $86 billion FCF over the NTM period
That is actually +11.1% higher (not lower) than the $77.4 billion Microsoft made over the last 12 months (LTM) period ending Q2 (Dec. 31, 2025).
That is why the market may have misjudged this higher capex spending. They forgot about higher revenue and higher operating cash flow.
So, what is MSFT stock worth?
Price Target for MSFT Stock
Let's assume that the market gives Microsoft's market cap a higher FCF yield (from 2.0% as I noted in my prior Barchart articles). In other words, instead of a 2.0% FCF yield (or 50x FCF), let's assume the market values the stock at just 45x FCF (i.e., a 2.22% FCF yield).
Therefore, using our assumptions, the market cap would be:
$86 billion FCF estimate x 45 = $3,870 billion mkt cap, or $3.87 trillion
But today's market cap is just $3.192 trillion, according to Yahoo! Finance. So, the true value of Microsoft, based on our projections, is +21.24% higher (i.e., $3.87 tr/$3.192 tr -1).
That implies a price target (PT) over $521 per share:
$430.13 price today x 1.2124 = $521.49 PT
Summary and Conclusion
That 21% increase in the price for MSFT stock includes the following assumptions:
- Capex rises 20% to $100 billion from the $83 billion over the last year,
- Management's statement that capex will decline sequentially from the $29 billion in Q2 (i.e., averaging $25 billion each quarter)
- Revenue rises 15.6% over the next 12 months, based on analysts' projections
- Operating cash flow rises 16% (i.e., a slight increase in the OCF margin)
The bottom line is that the dip in MSFT stock appears to be overdone. This is why value investors can look into various strategy plays, which I will address in a follow-up article.
On the date of publication, Mark R. Hake, CFA did not have (either directly or indirectly) positions in any of the securities mentioned in this article. All information and data in this article is solely for informational purposes. For more information please view the Barchart Disclosure Policy here.
More news from Barchart
- Microsoft's Free Cash Flow Crashes Due to High Capex - But Is MSFT Stock's Dip Overdone?
- Capitalize on Microsoft’s Unusual Options Activity with These Two Bullish Call Strategies
- Here’s How One Trader Screens Stocks to Find Better Covered Call Options Trade Ideas in Minutes
- 3 Red‑Hot ETFs With Unusual Put Options Activity — Grab the Income and the Upside


