

THIRD QUARTER 2023 HIGHLIGHTS (1)
- ATTRIBUTABLE AND ADJUSTED ATTRIBUTABLE DILUTED EARNINGS PER SHARE OF $0.07 AND $0.26, RESPECTIVELY
- QUARTERLY PRODUCTION OF 192,195 GOLD EQUIVALENT OUNCES AT COST OF SALES OF $1,095 AND AISC OF $1,289 PER OUNCE
- YEAR-TO-DATE PRODUCTION OF 495,668 GOLD EQUIVALENT OUNCES AT COST OF SALES OF $1,173 AND AISC OF $1,516 PER OUNCE
- REMAIN ON TRACK FOR THE LOW-END OF CONSOLIDATED PRODUCTION GUIDANCE OF 700,000 GOLD EQUIVALENT OUNCES
- QUARTERLY OPERATING CASH FLOW AND FREE CASH FLOW OF $135.3 MILLION AND $87.8 MILLION, RESPECTIVELY
- QUARTERLY OPERATING CASH FLOW AND FREE CASH FLOW BEFORE WORKING CAPITAL ADJUSTMENTS OF $142.4 MILLION AND $94.9 MILLION, RESPECTIVELY
- YEAR-TO-DATE 2023 CAPITAL RETURNS NOW TOTAL APPROXIMATELY $88.5 MILLION; ON TRACK FOR A MINIMUM FULL-YEAR CAPITAL RETURNS YIELD OF 3.6%
- ACCESSED FIRST ORE FROM THE ÇAKMAKTEPE EXTENSION PROJECT DURING THE THIRD QUARTER, FIRST PRODUCTION DELIVERED IN LATE SEPTEMBER IN LINE WITH GUIDANCE; EXPLORATION CONTINUES WITH AIM TO EXPAND MINERAL RESERVES AND RESOURCES
- PRODUCTION GUIDANCE TO BE RELEASED IN Q1/24 OUTLINING INITIATIVES TO DRIVE PRODUCTION GROWTH FROM EXPANSION PROJECTS
- INITIAL HOD MADEN INFILL DRILLING COMMENCES WITH AIM TO DE-RISK PRODUCTION RAMP-UP; POSITIVE RESULTS INCLUDE 90 METERS AT 16.5 G/T GOLD AND 1.56% COPPER
- SEABEE EXPLORATION CONTINUES TO ILLUSTRATE MINE LIFE EXTENSION POTENTIAL AT THE PORKY TARGETS, INCLUDING 5.6 METERS AT 46.1 G/T GOLD
- CONTINUED EXPLORATION AT THE CORTADERAS TARGET AT PUNA RETURNS 190 METERS AT 155 G/T SILVER AND 10.6% ZINC
- MARIGOLD EXPLORATION RESULTS EXPECTED TO OFFSET DEPLETION; ANALYSIS OF FUTURE GROWTH PATHWAYS AT NEW MILLENNIUM AND INITIAL MINERAL RESOURCES AT BUFFALO VALLEY ADVANCING
- CONTINUED NON-CORE ASSET RATIONALIZATION PROGRAM WITH THE DIVESTITURE OF THE SUNRISE LAKE EXPLORATION PROPERTY
SSR Mining Inc. (NASDAQ/TSX: SSRM, ASX: SSR) ("SSR Mining" or the “Company") reports consolidated financial results for the third quarter ended September 30, 2023. In addition, the Board of Directors declared a quarterly cash dividend of $0.07 per common share payable on December 11, 2023 to holders of record at the close of business on November 13, 2023. This dividend qualifies as an 'eligible dividend' for Canadian tax purposes.
This press release features multimedia. View the full release here: https://www.businesswire.com/news/home/20231030550829/en/
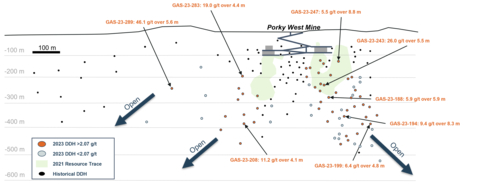
Figure 1. Long section looking north showing highlight intercepts from drilling at the Porky West target. (Photo: Business Wire)
Rod Antal, Executive Chairman of SSR Mining, said, “The third quarter of 2023 featured strong operating and financial results that were well aligned to our forecasts, including record production from Marigold and record throughput at Puna. In addition, first ore from Çakmaktepe Extension was accessed late in the quarter, and the project is on track to deliver initial production of 10,000 to 15,000 ounces in the fourth quarter of 2023 as planned. The results to date continue to put us on track for the lower-end of our production guidance in 2023.
As we work towards a strong finish to the year, we have also committed a substantive effort towards the advancement of refreshed technical reports for both Marigold and Çöpler. To ensure we best align the reoptimized production profiles at each asset with the growth trajectory of the overall portfolio, we now expect to release the results of this ongoing technical work alongside our guidance forecasts and updated Mineral Reserves and Resources in February 2024. The interim analysis of the work completed to-date is revealing initial positives with respect to replacing and expanding our Mineral Reserve and Mineral Resource base through recent exploration success.
At Çakmaktepe Extension in particular, continued exploration success has pointed to potential growth beyond the current Mineral Reserves at the mine. This increased scale has led to the re-evaluation of prior plans to heap leach the project’s oxide ore at recovery rates averaging approximately 60%. We are currently conducting trade-off studies evaluating the benefit of installing additional grinding and leaching capacity in the Çöpler processing facility to meaningfully improve gold recoveries. This value accretive pathway has the potential to increase the profitability of Çakmaktepe Extension, but will result in a delayed ramp up to full production levels from the mine until late 2026 given the potential addition of this incremental processing equipment.
As a result of the ongoing efforts to optimize our portfolio, the business is entering a three-year growth capital investment period, particularly at Hod Maden and Çöpler, and we expect adjustments to the production and cost profile over the upcoming three- to five-year period as compared to prior life of mine plans. While initial work to-date indicates that mine resequencing and optimization activities across the portfolio will drive 2024 production that is lower than 2023 levels at higher costs, annual gold production will grow as development projects at Hod Maden, Marigold and Çöpler are completed. We are excited by the high-return growth opportunities on the horizon as we continue to expand both the production levels and net asset value of our portfolio.”
(1) The Company reports non-GAAP financial measures including adjusted attributable net income, adjusted attributable net income per share, cash generated by operating activities before working capital adjustments, free cash flow, free cash flow before changes in working capital, total cash, net cash (debt), cash costs and all-in sustaining costs (“AISC”) per ounce sold (a common measure in the mining industry), to manage and evaluate its operating performance at its mines. See "Cautionary Note Regarding Non-GAAP Financial Measures" for an explanation of these financial measures and a reconciliation of these financial measures to the most comparable GAAP financial measures.
Third Quarter 2023 Highlights: (1)
(All figures are in US dollars unless otherwise noted)
- Strong quarterly operating performance: The Company delivered third quarter 2023 production of 192,195 gold equivalent ounces at Cost of sales of $1,095 per gold equivalent ounce and AISC of $1,289 per gold equivalent ounce. Year-to-date production is 495,668 gold equivalent ounces at Cost of sales of $1,173 per gold equivalent ounce and AISC of $1,516 per gold equivalent ounce. The Company continues to track towards the lower-end of its production guidance in 2023.
- Solid financial results including robust free cash flow generation: Attributable net income in the third quarter of 2023 was $15.2 million, or $0.07 per diluted share, reflecting one-time tax expenses associated with the previously announced increase of the corporate income tax rate in Türkiye from 20% to 25%. Adjusted attributable net income was $53.0 million, or $0.26 per diluted share. For the nine months ended September 30, 2023, attributable net income was $119.8 million, or $0.57 per diluted share, and adjusted attributable net income was $149.4 million, or $0.70 per diluted share. In the third quarter of 2023, operating cash flow was $135.3 million, or $142.4 million before working capital adjustments, and free cash flow was $87.8 million, or $94.9 million before working capital adjustments. Free cash flow is expected to remain strong in the fourth quarter of 2023, though sales are expected to lag production into year-end given the impact of the holiday season on metal shipments.
- Balance sheet continues to support organic growth initiatives: As of September 30, 2023, SSR Mining had a total cash balance of $437.8 million, reflecting $14.4 million in dividends paid to shareholders and $35.8 million in debt repayments made in the third quarter of 2023. SSR Mining has now extinguished the outstanding balance on its term loan and exited the third quarter of 2023 with a non-GAAP net cash position of $206.9 million and total available liquidity of $937.8 million, supporting the Company’s growth capital commitments over the coming three-year reinvestment period. Subsequent to the quarter, the Board declared a quarterly cash dividend of $0.07 per share to be paid on December 11, 2023. Including the fourth quarter 2023 dividend, the Company is expected to return a minimum of $102.7 million in capital returns in 2023, or a 3.6% yield.
- Revolving credit facility extended: On August 15, 2023, the Company announced that its existing revolving credit facility (the “Second Amended Credit Agreement”) was increased from $200 million to $400 million, with an additional accordion feature of $100 million. The Second Amended Credit Agreement has a renewed term of 4 years, and now matures on August 15, 2027. Under the terms of the increased facility, amounts that are borrowed will incur variable interest at the Secured Overnight Financing Rate plus an applicable margin ranging from 2.00% to 2.75%. The expanded facility will provide the Company with flexibility for working capital and other general corporate purposes.
- Çöpler planned maintenance completed; Çakmaktepe Extension delivers first production in the third quarter: Gold production was 56,768 ounces in the third quarter of 2023 at Cost of sales of $1,190 per ounce and AISC of $1,378 per ounce. Planned maintenance in the Çöpler sulfide plant was completed in the third quarter of 2023, and no further planned maintenance is expected until the fourth quarter of 2024. First ore from the Çakmaktepe Extension project was accessed late in the third quarter of 2023, and initial production from the mine was received at quarter’s end, in line with expectations.
- Record quarterly production at Marigold: Gold production of 83,272 ounces in the third quarter of 2023 was a record at Cost of sales of $980 per ounce and AISC of $1,106 per ounce. During the third quarter of 2023, newly acquired haul trucks intended for stripping activities at Red Dot were reassigned to ore mining in the Mackay pit as the Company focused on the delivery of 2023 guidance. This resequencing is likely to result in delayed access to first ore from Red Dot to the second half of 2024, deferring the associated production into 2025 and 2026.
- Seabee production recovers, grades and throughput to improve further in the fourth quarter: Gold production was 19,823 ounces in the third quarter of 2023 at Cost of sales of $1,026 per ounce and AISC of $1,382 per ounce. Seabee is on track for further production and cost improvement in the fourth quarter of 2023, as grades are forecasted to average between 6.0 g/t and 7.0 g/t in the quarter.
- Puna delivers record quarterly operating performance: Silver production in the third quarter of 2023 was 2.6 million ounces at Cost of sales of $15.23 per ounce of silver and AISC of $13.04 per ounce of silver. Quarterly process plant throughput averaged nearly 4,900 tonnes per day, a record for the mine.
- Exploration programs continue to showcase growth potential across the portfolio: SSR Mining’s significant investment in exploration activities across its operations has continued to yield success indicating potential for Mineral Reserve and Mineral Resource growth across the portfolio. At Seabee, regional exploration activities have focused on the Porky West and Petunia targets with more than 80 holes drilled in 2023, including 46.1 g/t gold over 5.6 meters at Porky West. At Puna’s Cortaderas target, nine holes have returned assay results since the March 2023 exploration update from the mine, including a 190 meter intercept of 155 g/t silver and 10.6% zinc (479 g/t AgEq). SSR Mining has also commenced an infill drilling campaign at Hod Maden with the aim to de-risk the ramp up of initial mining at the project, expected in 2027. The three holes with assays returned to date include a highlight intercept of 90 meters at 16.5 g/t gold and 1.56% copper, reiterating the world class nature of the Hod Maden orebody.
- High-return development projects expected to drive meaningful production growth over the three- to five-year period: SSR Mining is currently reviewing its forward-looking production profile ahead of 2024 and multi-year guidance that will be announced in the first quarter of 2024. A number of low capital intensity, high-return organic growth projects, including Hod Maden, the Red Dot deposit at Marigold and the grind and leach circuit for Çakmaktepe Extension, are expected to drive future production growth. Advancing these projects effectively, as well the resequencing of waste stripping at Marigold and the transition to mining of the Gap Hanging Wall ore body at Seabee, is expected to bring 2024 production below 2023 levels at higher costs.
- Non-core Sunrise Lake exploration property divested: Subsequent to quarter’s end, SSR Mining announced a definitive agreement to sell its Sunrise Lake Property (“Sunrise Lake” or the “Property”) in exchange for a 4.0% net smelter return (“NSR”) royalty on the Property. Under the terms of the agreement, at any time until commencement of construction activities, 2.0% of the NSR royalty can be repurchased by Honey Badger for total consideration of $10 million.
Financial and Operating Highlights
A summary of the Company's consolidated financial and operating results for the three and nine months ended September 30, 2023 and September 30, 2022 are presented below:
|
|
Three Months Ended |
|
Nine Months Ended |
||||||||||||||||
(in thousands of US dollars, except per share data) |
|
September 30, |
|
September 30, |
||||||||||||||||
|
|
2023 |
|
2022 |
|
2023 |
|
2022 |
||||||||||||
Financial Results |
|
|
|
|
|
|
|
|
|
|
|
|
||||||||
Revenue |
|
$ |
385,390 |
|
|
$ |
166,627 |
|
|
$ |
1,001,030 |
|
|
$ |
841,656 |
|
||||
Cost of sales |
|
$ |
214,670 |
|
|
$ |
106,452 |
|
|
$ |
584,607 |
|
|
$ |
424,900 |
|
||||
Operating income |
|
$ |
77,465 |
|
|
$ |
(35,064 |
) |
|
$ |
167,379 |
|
|
$ |
150,901 |
|
||||
Net income |
|
$ |
(7,245 |
) |
|
$ |
(28,372 |
) |
|
$ |
144,135 |
|
|
$ |
115,251 |
|
||||
Net income attributable to SSR Mining shareholders |
|
$ |
15,159 |
|
|
$ |
(25,793 |
) |
|
$ |
119,838 |
|
|
$ |
100,256 |
|
||||
Basic net income per share attributable to SSR Mining shareholders |
|
$ |
0.07 |
|
|
$ |
(0.12 |
) |
|
$ |
0.58 |
|
|
$ |
0.48 |
|
||||
Diluted net income per share attributable to SSR Mining shareholders |
|
$ |
0.07 |
|
|
$ |
(0.12 |
) |
|
$ |
0.57 |
|
|
$ |
0.46 |
|
||||
Adjusted attributable net income (2) |
|
$ |
53,040 |
|
|
$ |
(13,533 |
) |
|
$ |
149,417 |
|
|
$ |
119,234 |
|
||||
Adjusted basic attributable net income per share (2) |
|
$ |
0.26 |
|
|
$ |
(0.07 |
) |
|
$ |
0.73 |
|
|
$ |
0.57 |
|
||||
Adjusted diluted attributable net income per share (2) |
|
$ |
0.26 |
|
|
$ |
(0.07 |
) |
|
$ |
0.70 |
|
|
$ |
0.55 |
|
||||
|
|
|
|
|
|
|
|
|
|
|
||||||||||
Cash generated by operating activities before changes in working capital (2) |
|
$ |
142,350 |
|
|
$ |
(23,666 |
) |
|
$ |
337,484 |
|
|
$ |
212,703 |
|
||||
Cash generated by operating activities |
|
$ |
135,256 |
|
|
$ |
(52,226 |
) |
|
$ |
218,566 |
|
|
$ |
42,799 |
|
||||
Cash used in investing activities |
|
$ |
(48,470 |
) |
|
$ |
(12,238 |
) |
|
$ |
(280,211 |
) |
|
$ |
(69,983 |
) |
||||
Cash used in financing activities |
|
$ |
(46,672 |
) |
|
$ |
(121,951 |
) |
|
$ |
(157,806 |
) |
|
$ |
(238,634 |
) |
||||
|
|
|
|
|
|
|
|
|
|
|
||||||||||
Operating Results |
|
|
|
|
|
|
|
|
|
|
||||||||||
Gold produced (oz) |
|
|
|
159,863 |
|
|
|
|
76,462 |
|
|
|
|
411,587 |
|
|
|
|
368,972 |
|
Gold sold (oz) |
|
|
|
161,227 |
|
|
|
|
72,035 |
|
|
|
|
412,254 |
|
|
|
|
375,543 |
|
Silver produced ('000 oz) |
|
|
|
2,645 |
|
|
|
|
2,738 |
|
|
|
|
6,930 |
|
|
|
|
6,008 |
|
Silver sold ('000 oz) |
|
|
|
2,852 |
|
|
|
|
2,234 |
|
|
|
|
7,090 |
|
|
|
|
5,766 |
|
Lead produced ('000 lb) (3) |
|
|
|
10,403 |
|
|
|
|
11,390 |
|
|
|
|
31,957 |
|
|
|
|
27,582 |
|
Lead sold ('000 lb) (3) |
|
|
|
11,707 |
|
|
|
|
9,169 |
|
|
|
|
34,882 |
|
|
|
|
28,255 |
|
Zinc produced ('000 lb) (3) |
|
|
|
1,577 |
|
|
|
|
1,590 |
|
|
|
|
5,805 |
|
|
|
|
4,940 |
|
Zinc sold ('000 lb) (3) |
|
|
|
1,454 |
|
|
|
|
1,050 |
|
|
|
|
6,174 |
|
|
|
|
5,546 |
|
|
|
|
|
|
|
|
|
|
|
|
||||||||||
Gold equivalent produced (oz) (3) |
|
|
|
192,195 |
|
|
|
|
106,919 |
|
|
|
|
495,668 |
|
|
|
|
441,164 |
|
Gold equivalent sold (oz) (3) |
|
|
|
196,088 |
|
|
|
|
96,885 |
|
|
|
|
498,284 |
|
|
|
|
444,827 |
|
|
|
|
|
|
|
|
|
|
|
|
||||||||||
Average realized gold price ($/oz sold) |
|
$ |
1,913 |
|
|
$ |
1,691 |
|
|
$ |
1,925 |
|
|
$ |
1,836 |
|
||||
Average realized silver price ($/oz sold) |
|
$ |
21.99 |
|
|
$ |
16.75 |
|
|
$ |
23.14 |
|
|
$ |
19.82 |
|
||||
|
|
|
|
|
|
|
|
|
|
|
||||||||||
Cost of sales per gold equivalent ounce sold (4) |
|
$ |
1,095 |
|
|
$ |
1,099 |
|
|
$ |
1,173 |
|
|
$ |
955 |
|
||||
Cash cost per gold equivalent ounce sold (2, 4) |
|
$ |
1,046 |
|
|
$ |
1,051 |
|
|
$ |
1,114 |
|
|
$ |
891 |
|
||||
AISC per gold equivalent ounce sold (2, 4) |
|
$ |
1,289 |
|
|
$ |
1,901 |
|
|
$ |
1,516 |
|
|
$ |
1,331 |
|
||||
|
|
|
|
|
|
|
|
|
|
|
|
|
||||||||
Financial Position |
|
September 30, 2023 |
|
December 31, 2022 |
||||||||||||||||
Cash and cash equivalents |
|
$ |
|
|
437,675 |
|
|
$ |
|
|
655,453 |
|
||||||||
Current assets |
|
$ |
|
|
1,157,979 |
|
|
$ |
|
|
1,376,435 |
|
||||||||
Total assets |
|
$ |
|
|
5,749,660 |
|
|
$ |
|
|
5,254,657 |
|
||||||||
Current liabilities |
|
$ |
|
|
166,145 |
|
|
$ |
|
|
279,252 |
|
||||||||
Total liabilities |
|
$ |
|
|
1,156,545 |
|
|
$ |
|
|
1,128,458 |
|
||||||||
Working capital (5) |
|
$ |
|
|
991,834 |
|
|
$ |
|
|
1,097,183 |
|
||||||||
(2) The Company reports non-GAAP financial measures including adjusted attributable net income, adjusted attributable net income per share, cash generated by operating activities before changes in working capital, cash costs and AISC per ounce sold to manage and evaluate its operating performance at its mines. See “Non-GAAP Financial Measures” at the end of this press release for an explanation of these financial measures and a reconciliation of these financial measures to net income (loss) attributable to SSR Mining shareholders, Cost of sales, and cash generated by operating activities, which are the most comparable GAAP financial measures. Cost of sales excludes depreciation, depletion, and amortization.
(3) Data for lead production and sales relate only to lead in lead concentrate. Data for zinc production and sales relate only to zinc in zinc concentrate.
(4) Gold equivalent ounces are calculated by multiplying the silver ounces by the ratio of the silver price to the gold price, using the average London Bullion Market Association (“LBMA”) prices for the period. The Company does not include by-products in the gold equivalent ounce calculations.
(5) Working capital is defined as current assets less current liabilities.
Çöpler, Türkiye |
||||||||||||
(amounts presented on 100% basis) |
||||||||||||
|
|
Three Months Ended |
|
Nine Months Ended |
||||||||
|
|
September 30, |
|
September 30, |
||||||||
Operating Data |
|
2023 |
|
2022 |
|
2023 |
|
2022 |
||||
Gold produced (oz) |
|
|
56,768 |
|
|
3,733 |
|
|
163,873 |
|
|
125,763 |
Gold sold (oz) |
|
|
58,694 |
|
|
2,591 |
|
|
165,905 |
|
|
132,862 |
|
|
|
|
|
|
|
|
|
|
|
|
|
Ore mined (kt) |
|
|
915 |
|
|
70 |
|
|
3,278 |
|
|
1,754 |
Waste removed (kt) |
|
|
7,448 |
|
|
406 |
|
|
17,664 |
|
|
11,715 |
Total material mined (kt) |
|
|
8,363 |
|
|
476 |
|
|
20,942 |
|
|
13,469 |
Strip ratio |
|
|
8.1 |
|
|
5.8 |
|
|
5.4 |
|
|
6.7 |
|
|
|
|
|
|
|
|
|
|
|
|
|
Ore stacked (kt) |
|
|
289 |
|
|
— |
|
|
631 |
|
|
210 |
Gold grade stacked (g/t) |
|
|
1.47 |
|
|
— |
|
|
1.40 |
|
|
0.87 |
|
|
|
|
|
|
|
|
|
|
|
|
|
Ore milled (kt) |
|
|
618 |
|
|
64 |
|
|
2,022 |
|
|
1,320 |
Gold mill feed grade (g/t) |
|
|
2.92 |
|
|
2.27 |
|
|
2.56 |
|
|
2.91 |
Gold recovery (%) |
|
|
85.1 |
|
|
86.0 |
|
|
87.2 |
|
|
87.1 |
|
|
|
|
|
|
|
|
|
|
|
|
|
Average realized gold price ($/oz sold) |
|
$ |
1,928 |
|
$ |
1,641 |
|
$ |
1,930 |
|
$ |
1,864 |
Cost of sales ($/oz gold sold) |
|
$ |
1,190 |
|
$ |
118 |
|
$ |
1,202 |
|
$ |
948 |
Cash costs ($/oz gold sold) (6) |
|
$ |
1,167 |
|
$ |
160 |
|
$ |
1,186 |
|
$ |
928 |
AISC ($/oz gold sold) (6) |
|
$ |
1,378 |
|
$ |
14,972 |
|
$ |
1,397 |
|
$ |
1,351 |
(6) The Company reports the non-GAAP financial measures of cash costs and AISC per ounce of gold sold to manage and evaluate operating performance at Çöpler. See "Non-GAAP Financial Measures" for an explanation of these financial measures and a reconciliation to Cost of sales, which are the comparable GAAP financial measure. Cost of sales excludes depreciation, depletion, and amortization.
For the three months ended September 30, 2023 and 2022, Çöpler produced 56,768 and 3,733 ounces of gold, respectively. For the nine months ended September 30, 2023 and 2022, Çöpler produced 163,873 and 125,763 ounces of gold, respectively. Third quarter 2023 Cost of sales of $1,190 per ounce and AISC of $1,378 per ounce reflected normal course costs associated with the planned maintenance of the sulfide plant that was completed in the quarter.
The Çakmaktepe Extension project accessed first ore in the third quarter of 2023, and subsequently delivered first production in late September 2023. Çakmaktepe Extension remains on track to produce 10,000 to 15,000 ounces of gold in the fourth quarter 2023.
Marigold, USA |
||||||||||||
|
|
Three Months Ended |
|
Nine Months Ended |
||||||||
|
|
September 30, |
|
September 30, |
||||||||
Operating Data |
|
2023 |
|
2022 |
|
2023 |
|
2022 |
||||
Gold produced (oz) |
|
|
83,272 |
|
|
52,236 |
|
|
195,694 |
|
|
131,793 |
Gold sold (oz) |
|
|
83,103 |
|
|
49,744 |
|
|
194,789 |
|
|
132,681 |
|
|
|
|
|
|
|
|
|
|
|
|
|
Ore mined (kt) |
|
|
7,732 |
|
|
4,279 |
|
|
18,141 |
|
|
13,200 |
Waste removed (kt) |
|
|
16,329 |
|
|
15,922 |
|
|
49,007 |
|
|
56,286 |
Total material mined (kt) |
|
|
24,061 |
|
|
20,201 |
|
|
67,148 |
|
|
69,486 |
Strip ratio |
|
|
2.1 |
|
|
3.7 |
|
|
2.7 |
|
|
4.3 |
|
|
|
|
|
|
|
|
|
|
|
|
|
Ore stacked (kt) |
|
|
7,732 |
|
|
4,279 |
|
|
18,141 |
|
|
13,200 |
Gold grade stacked (g/t) |
|
|
0.45 |
|
|
0.59 |
|
|
0.46 |
|
|
0.54 |
|
|
|
|
|
|
|
|
|
|
|
|
|
Average realized gold price ($/oz sold) |
|
$ |
1,908 |
|
$ |
1,692 |
|
$ |
1,923 |
|
$ |
1,797 |
Cost of sales costs ($/oz gold sold) |
|
$ |
980 |
|
$ |
1,079 |
|
$ |
1,027 |
|
$ |
1,077 |
Cash costs ($/oz gold sold) (7) |
|
$ |
981 |
|
$ |
1,081 |
|
$ |
1,029 |
|
$ |
1,078 |
AISC ($/oz gold sold) (7) |
|
$ |
1,106 |
|
$ |
1,444 |
|
$ |
1,423 |
|
$ |
1,482 |
(7) The Company reports the non-GAAP financial measures of cash costs and AISC per ounce of gold sold to manage and evaluate operating performance at Marigold. See "Non-GAAP Financial Measures" for an explanation of these financial measures and a reconciliation to Cost of sales, which are the comparable GAAP financial measure. Cost of sales excludes depreciation, depletion, and amortization.
For the three months ended September 30, 2023 and 2022, Marigold produced 83,272 and 52,236 ounces of gold, respectively. For the nine months ended September 30, 2023 and 2022, Marigold produced 195,694 and 131,793 ounces of gold, respectively. Third quarter 2023 Cost of sales were $980 per ounce and AISC were $1,106 per ounce.
During the third quarter of 2023, newly acquired haul trucks intended for stripping activities at Red Dot were reassigned to ore mining in the Mackay pit as the Company focused on the delivery of 2023 guidance. This resequencing is likely to result in delayed access to first ore from Red Dot to the second half of 2024, deferring the associated production into 2025 and 2026.
Seabee, Canada |
||||||||||||
|
|
Three Months Ended |
|
Nine Months Ended |
||||||||
|
|
September 30, |
|
September 30, |
||||||||
Operating Data |
|
2023 |
|
2022 |
|
2023 |
|
2022 |
||||
Gold produced (oz) |
|
|
19,823 |
|
|
20,493 |
|
|
52,020 |
|
|
111,416 |
Gold sold (oz) |
|
|
19,430 |
|
|
19,700 |
|
|
51,560 |
|
|
110,000 |
|
|
|
|
|
|
|
|
|
|
|
|
|
Ore mined (kt) |
|
|
108 |
|
|
108 |
|
|
326 |
|
|
307 |
|
|
|
|
|
|
|
|
|
|
|
|
|
Ore milled (kt) |
|
|
105 |
|
|
101 |
|
|
323 |
|
|
295 |
Gold mill feed grade (g/t) |
|
|
6.17 |
|
|
6.07 |
|
|
5.29 |
|
|
11.84 |
Gold recovery (%) |
|
|
96.5 |
|
|
97.3 |
|
|
96.5 |
|
|
98.2 |
|
|
|
|
|
|
|
|
|
|
|
|
|
Average realized gold price ($/oz sold) |
|
$ |
1,884 |
|
$ |
1,693 |
|
$ |
1,915 |
|
$ |
1,849 |
Cost of sales ($/oz gold sold) |
|
$ |
1,026 |
|
$ |
908 |
|
$ |
1,192 |
|
$ |
485 |
Cash costs ($/oz gold sold) (8) |
|
$ |
1,027 |
|
$ |
910 |
|
$ |
1,193 |
|
$ |
486 |
AISC ($/oz gold sold) (8) |
|
$ |
1,382 |
|
$ |
1,304 |
|
$ |
1,742 |
|
$ |
735 |
(8) The Company reports the non-GAAP financial measures of cash costs and AISC per ounce of gold sold to manage and evaluate operating performance at Seabee. See "Non-GAAP Financial Measures" for an explanation of these financial measures and a reconciliation to Cost of sales, which are the comparable GAAP financial measure. Cost of sales excludes depreciation, depletion, and amortization.
For the three months ended September 30, 2023 and 2022, Seabee produced 19,823 and 20,493 ounces of gold, respectively. For the nine months ended September 30, 2023 and 2022, Seabee produced 52,020 and 111,416 ounces of gold, respectively. Improved production resulted in third quarter 2023 Cost of sales of $1,026 per ounce and AISC of $1,382 per ounce.
SSR Mining continues to invest significantly in near-mine and regional exploration at Seabee as the Company seeks to extend the existing Mineral Reserve life of the operation. In 2023, drilling at the Porky West and Petunia targets has been a focus for the resource development team. In Seabee’s 2021 Technical Report Summary, Porky West hosted approximately 8,000 ounces of Indicated Mineral Resources and approximately 73,000 ounces of Inferred Mineral Resources. Since that time, exploration has focused on step-out and expansion drilling across the greater Porky target area with success.
At present, mineralization at Porky West has been identified to 500 meters of vertical depth and remains open down plunge. Incorporating both Porky West and the Petunia target, mineralization has been identified along 1,250 meters of strike and remains open in both directions. Initial analysis of ongoing technical work indicates the potential for a positive updated resource for the Porky targets. If exploration and initial economic studies are successful, the targets have potential as a new underground mining area for the Seabee operation.
Highlights from 2023 drilling at the Porky targets include (see Figure 1) (see Table 1 for full assay results) (all intercepts true width and uncut):
- GAS-23-289: 46.1 g/t Au over 5.6 meters from 242.0 meters
- GAS-23-243: 26.0 g/t Au over 5.5 meters from 193.0 meters
- GAS-23-283: 19.0 g/t Au over 4.4 meters from 190.0 meters
- GAS-23-194: 9.4 g/t Au over 8.3 meters from 350.2 meters
Puna, Argentina |
||||||||||||
|
|
Three Months Ended |
|
Nine Months Ended |
||||||||
|
|
September 30, |
|
September 30, |
||||||||
Operating Data |
|
2023 |
|
2022 |
|
2023 |
|
2022 |
||||
Silver produced ('000 oz) |
|
|
2,645 |
|
|
2,738 |
|
|
6,930 |
|
|
6,008 |
Silver sold ('000 oz) |
|
|
2,852 |
|
|
2,234 |
|
|
7,090 |
|
|
5,766 |
Lead produced ('000 lb) |
|
|
10,403 |
|
|
11,390 |
|
|
31,957 |
|
|
27,582 |
Lead sold ('000 lb) |
|
|
11,707 |
|
|
9,169 |
|
|
34,882 |
|
|
28,255 |
Zinc produced ('000 lb) |
|
|
1,577 |
|
|
1,590 |
|
|
5,805 |
|
|
4,940 |
Zinc sold ('000 lb) |
|
|
1,454 |
|
|
1,050 |
|
|
6,174 |
|
|
5,546 |
Gold equivalent sold ('000 oz) (9) |
|
|
34,861 |
|
|
24,850 |
|
|
86,030 |
|
|
69,284 |
|
|
|
|
|
|
|
|
|
|
|
|
|
Ore mined (kt) |
|
|
522 |
|
|
544 |
|
|
1,381 |
|
|
1,396 |
Waste removed (kt) |
|
|
1,356 |
|
|
2,228 |
|
|
4,864 |
|
|
6,617 |
Total material mined (kt) |
|
|
1,878 |
|
|
2,772 |
|
|
6,245 |
|
|
8,013 |
Strip ratio |
|
|
2.6 |
|
|
4.1 |
|
|
3.5 |
|
|
4.7 |
|
|
|
|
|
|
|
|
|
|
|
|
|
Ore milled (kt) |
|
|
445 |
|
|
431 |
|
|
1,278 |
|
|
1,223 |
Silver mill feed grade (g/t) |
|
|
192.7 |
|
|
206.5 |
|
|
175.6 |
|
|
159.9 |
Lead mill feed grade (%) |
|
|
1.14 |
|
|
1.29 |
|
|
1.21 |
|
|
1.11 |
Zinc mill feed grade (%) |
|
|
0.32 |
|
|
0.43 |
|
|
0.37 |
|
|
0.42 |
Silver mill recovery (%) |
|
|
96.0 |
|
|
95.8 |
|
|
96.0 |
|
|
95.6 |
Lead mill recovery (%) |
|
|
93.4 |
|
|
92.7 |
|
|
93.8 |
|
|
92.5 |
Zinc mill recovery (%) |
|
|
49.9 |
|
|
38.9 |
|
|
55.4 |
|
|
43.7 |
|
|
|
|
|
|
|
|
|
|
|
|
|
Average realized silver price ($/oz sold) |
|
$ |
21.99 |
|
$ |
16.75 |
|
$ |
23.14 |
|
$ |
19.82 |
Cost of sales ($/oz sold) |
|
$ |
15.23 |
|
$ |
15.47 |
|
$ |
17.45 |
|
$ |
17.82 |
Cash costs ($/oz silver sold) (10) |
|
$ |
12.33 |
|
$ |
13.33 |
|
$ |
13.57 |
|
$ |
13.31 |
AISC ($/oz silver sold) (10) |
|
$ |
13.04 |
|
$ |
15.91 |
|
$ |
15.31 |
|
$ |
15.32 |
(9) Gold equivalent ounces are calculated multiplying the silver ounces by the ratio of the silver price to the gold price, using the average LBMA prices for the period. The Company does not include by-products in the gold equivalent ounce calculations.
(10) The Company reports the non-GAAP financial measures of cash costs and AISC per ounce of silver sold to manage and evaluate operating performance at Puna. See "Non-GAAP Financial Measures" for an explanation of these financial measures and a reconciliation to Cost of sales, which are the comparable GAAP financial measure. Cost of sales excludes depreciation, depletion, and amortization
For the three months ended September 30, 2023 and 2022, Puna produced 2.6 million and 2.7 million ounces of silver, respectively with the year-over-year increase primarily driven by higher mill feed grade. For the nine months ended September 30, 2023 and 2022, Puna produced 6.9 million and 6.0 million ounces of silver, respectively. Third quarter 2023 Cost of sales of $15.23 per ounce of silver sold and AISC of $13.04 per ounce of silver sold were in line with expectations.
Since the release of positive exploration results from Puna in March, 2023, SSR Mining has continued exploration across both the Chinchillas and Pirquitas properties targeting potential mine life extensions for the operation. A focus of the 2023 drilling campaign is the Cortaderas target located approximately seven kilometers west of the Pirquitas processing facility, which has potential as a new development pathway for Puna over the medium-term. Reinterpretation of historical drill results suggested an area of mineralization directly adjacent to the existing Cortaderas deposit, and drilling in 2023 has confirmed the presence of high-grade silver and zinc mineralization in this area now referred to as Cortaderas Hangingwall. Of the nine holes with assay data returned, seven intersected the north-dipping Cortaderas Hangingwall target, and mineralization has currently been identified over a strike length of 450 meters. The target remains open along trend.
Highlights from 2023 drilling at Cortaderas include (see Figure 2) (see Table 2 for full assay results) (all intercepts core length and uncut):
-
DDH-406: 155 g/t Ag and 10.6% Zn (479 g/t AgEq) over 190 meters from 230 meters
- Including: 332 g/t Ag and 22.8% Zn (1,020 g/t AgEq) over 53 meters from 276 meters
-
DDH-400: 391 g/t Ag and 2.2% Zn (388 g/t AgEq) over 33 meters from 596 meters
- And: 3,325 g/t Ag and 0.7% Zn (2,719 g/t AgEq) over 4 meters from 385 meters
- DDH-405: 198 g/t Ag and 4.0% Zn (291 g/t AgEq) over 45 meters from 495 meters
Conference Call Information
This news release should be read in conjunction with the Company’s Quarterly Report on Form 10-Q for the quarter ended September 30, 2023, filed with the U.S. Securities and Exchange Commission (the “SEC”) and available on the SEC website at www.sec.gov or www.ssrmining.com.
- Conference call and webcast: Wednesday, November 1, 2023, at 5:00 pm EDT.
|
Toll-free in U.S. and Canada: |
+1 (800) 319-4610 |
|
|
All other callers: |
+1 (604) 638-5340 |
|
|
Webcast: |
- The conference call will be archived and available on our website. Audio replay will be available for two weeks by calling:
|
Toll-free in U.S. and Canada: |
+1 (855) 669-9658, replay code 0374 |
|
|
All other callers: |
+1 (412) 317-0088, replay code 0374 |
Dividend Declaration
On November 1, 2023 the Board of Directors declared a quarterly cash dividend of $0.07 per common share, payable on December 11, 2023 to holders of record at the close of business on November 13, 2023. This dividend qualifies as an 'eligible dividend' for Canadian income tax purposes.
The dividend payment applies to holders of SSR Mining’s common shares, which trade on the Toronto Stock Exchange and the Nasdaq under the symbol SSRM, and to holders of its CHESS Depositary Interests ("CDIs"), which trade on the Australian Securities Exchange under the symbol SSR. Each CDI confers a beneficial interest in one common share. Therefore, CDI holders are entitled to a dividend calculated on the same basis as the holders of SSR Mining’s common shares.
SSR Mining has sought and been granted a temporary waiver of certain of the ASX Settlement Operating Rules. Under the authority of the waiver, the processing of conversions of common shares to CDIs, or CDIs to common shares, lodged on or after or after November 10, 2023, will be deferred until after the record date of November 13, 2023. The key dates with respect to the dividend are as follows:
Last date for processing requests to convert CDIs into common
|
|
November 9, 2023 |
CDIs trade on the ASX on an ex‐dividend basis |
|
November 10, 2023 |
Common shares trade on the TSX and Nasdaq on an ex‐dividend basis |
|
November 10, 2023 |
Record date for the dividend |
|
November 13, 2023 |
Processing recommences for requests to convert CDIs into common shares and to convert
|
|
November 14, 2023 |
Common share dividend payment date (in Canada and the United States) |
|
December 11, 2023 |
Payment of dividend to CDI holders (in Australia) |
|
December 12, 2023 |
Payments to Canadian shareholders will be made in Canadian dollars based on the exchange rate on the record date as reported by the Bank of Canada. Payments to other shareholders will be made in U.S. dollars. For CDI holders, payments will be made in Australian dollars, and it is expected to be based on the prevailing exchange rate sourced from the wholesale foreign exchange market on or around 5 business days after the record date.
About SSR Mining
SSR Mining Inc. is a leading, free cash flow focused gold company with four producing operations located in the USA, Türkiye, Canada, and Argentina, combined with a global pipeline of high-quality development and exploration assets. Over the last three years, the four operating assets combined have produced on average more than 700,000 gold-equivalent ounces annually. SSR Mining is listed under the ticker symbol SSRM on the NASDAQ and the TSX, and SSR on the ASX.
Sampling and Analytical Procedures
All Porky drilling samples completed since May 28th, 2023 were sent to ALS Geochemistry in Vancouver, Canada which is an accredited laboratory independent of SSR Mining. SSR Mining conducts routine QA/QC analysis on all assay results, including the systematic utilization of certified reference materials, blanks, field duplicates, analytical duplicates and umpire laboratory check assays. Mean results of the spot checks were consistent with those reported. Sampling interval was established by minimum or maximum sampling lengths and geological and/or structural criteria. ALS prepares a crusher/rotary splitter combo, crushing to 70% less than 2 mm, rotary splitting off 1 kg, and pulverizing split to better than 85% passing 75 microns. Fire assay with Atomic Absorption finish was completed on a 50 g aliquot to produce gold analytical results with a 0.01 g/t gold detection limit. Fire assay with gravimetric finish was prepared on those samples with greater than 10 g/t gold result, with a 0.05 g/t gold detection limit.
All Porky drill samples prior to May 28th, 2023 were assayed by SSR Mining's onsite non-accredited assay laboratory, which is not independent from SSR Mining. Duplicate check assays were conducted at site as well as at ALS Laboratories, Winnipeg, which is independent from SSR Mining. Mean results of the spot checks were consistent with those reported. Sampling interval was established by minimum or maximum sampling lengths and geological and/or structural criteria. Seabee’s site lab typically prepares two hundred-gram samples that were pulverized until greater than 80 percent passed through a 150-mesh screen. Thirty-gram pulp samples were then analyzed for gold by fire assay with gravimetric finish (0.01 g/t gold detection limit).
All drill samples of Cortaderas surface drilling program were analyzed at Alex Stewart Laboratories (“ASL”), Argentina. SSR Mining’s drill and geochemical samples were collected in accordance with accepted industry standards. SSR Mining conducts routine QA/QC analysis on all assay results, including the systematic utilization of certified reference materials, blanks, field duplicates, analytical duplicates and umpire laboratory check assays. Sampling interval was most commonly 1 meter, using geological and/or structural criteria. ASL crushed each sample to 80% passing 2 mm and a 200 g split was pulverized to better than 95% passing 106 microns. A four-acid multi-element analysis with a MS finish, using a 0.2 g sample, was used to produce Ag, Pb and Zn analytical results. For all Ag results >200 ppm, or Pb and Zn results >10,000 ppm, a four acid overlimit method (optic) was completed using a 0.2 g sample size. For all Ag results >2000 ppm a gravimetric analytical method was completed using 0.3 g sample size.
All drill samples in respect to the Hod Maden drilling program were analyzed at ALS Laboratories (“ALS”) in İzmir and SGS Laboratories in Ankara, Türkiye. SSR Mining’s drill and geochemical samples were collected in accordance with accepted industry standards. SSR Mining conducts routine QA/QC analysis on all assay results, including the systematic utilization of certified reference materials, blanks, field duplicates and umpire laboratory check assays. The sampling interval was most commonly 1 meter, using geological and/or structural criteria. The analysis method of the drilling conducted by SGS Ankara is performed for trace multi-element (ICP 40B) and trace gold (FA 303) in order to detect the gold concentrate between 0.01 and 100 ppm (30 g fire assay). The analysis method of the drilling conducted by ALS Chemex Izmir is performed for trace multi-element (ME-ICP 61a) and trace gold (Au-AA25) in order to detect the gold concentrate between 0.01 and 100 ppm (30 g fire assay). All samples from drilling completed since June 2023 were analyzed by ALS Chemex İzmir for trace multi-element (ME-MS61) 4 acid digestion with ICP-AES & ICP-MS analysis for 48 elements and trace gold (Au-AA24) in order to detect the gold concentrate between 0.005 and 10 ppm (50 g fire assay).
There were no adverse material results detected and the QA/QC indicates the information collected is acceptable, and the database can be used for further studies.
Qualified Persons
The scientific and technical information concerning our mineral projects in this news release have been reviewed and approved by a “qualified person” for purposes of Subpart 1300 of Regulation S-K (“SK-1300”) and National Instrument 43-101 – Standards of Disclosure for Mineral Projects (“NI 43-101”). Specifically, the scientific and technical data in this news release relating to: (i) resource development activity at the Seabee property has been reviewed and approved by Jeffrey Kulas, P.Geo., Manager, Resource Development; (ii) exploration activity at the Puna Project has been reviewed and approved by David Gale, P.Geo., Senior Manager, Exploration; and (iii) exploration activity at the Hod Maden Project has been reviewed and approved by Rex Brommecker, P.Geo., Senior Vice President, Exploration; each of whom is a qualified person for purposes of SK-1300 and NI 43-101. For a description of the key assumptions, parameters and methods used to estimate mineral reserves and mineral resources for SSR Mining Inc.’s material properties included in this news release, as well as data verification procedures and a general discussion of the extent to which the estimates may be affected by any known environmental, permitting, legal, title, taxation, sociopolitical, marketing or other relevant factors, please review the Technical Report Summaries for each of the Company’s material properties which are available at www.sec.gov.
Drill Result Tables
Table 1: All drill holes completed at the Porky targets between August 2022 and August 2023. |
|||||
Hole ID |
From
|
To
|
Interval
|
Gold
|
|
GAS-22-176 |
293.2 |
298.3 |
4.9 |
1.2 |
|
GAS-22-177 |
310.0 |
313.0 |
2.7 |
0.0 |
|
GAS-22-178 |
343.6 |
345.0 |
1.3 |
0.4 |
|
GAS-22-180 |
305.0 |
314.7 |
9.5 |
0.7 |
|
GAS-22-181 |
303.0 |
317.0 |
13.6 |
4.9 |
|
GAS-22-182 |
343.4 |
347.5 |
3.9 |
1.6 |
|
GAS-22-183 |
346.0 |
355.0 |
7.5 |
19.9 |
|
GAS-22-184 |
304.0 |
324.9 |
15.0 |
0.5 |
|
GAS-22-185 |
325.0 |
331.0 |
5.0 |
0.9 |
|
GAS-22-186 |
359.0 |
364.0 |
4.2 |
1.3 |
|
GAS-22-187 |
382.4 |
384.0 |
1.2 |
2.0 |
|
GAS-23-188 |
309.4 |
315.8 |
5.9 |
5.9 |
|
GAS-23-189 |
339.0 |
341.6 |
2.2 |
2.6 |
|
GAS-23-190 |
311.0 |
316.0 |
4.5 |
5.1 |
|
GAS-23-191 |
262.7 |
265.7 |
2.7 |
0.3 |
|
GAS-23-192 |
300.0 |
305.3 |
4.3 |
0.5 |
|
GAS-23-193 |
329.0 |
331.0 |
1.5 |
0.3 |
|
GAS-23-194 |
350.2 |
359.7 |
8.3 |
9.4 |
|
GAS-23-195 |
344.6 |
347.8 |
3.0 |
0.1 |
|
GAS-23-196 |
326.0 |
329.0 |
2.9 |
3.6 |
|
GAS-23-197 |
355.3 |
358.3 |
2.4 |
3.5 |
|
394.9 |
402.8 |
6.5 |
3.6 |
||
GAS-23-198 |
342.4 |
347.0 |
4.2 |
1.6 |
|
GAS-23-199 |
374.9 |
380.6 |
4.8 |
6.4 |
|
GAS-23-200 |
252.0 |
255.1 |
2.2 |
4.2 |
|
GAS-23-201 |
217.6 |
225.0 |
5.9 |
5.3 |
|
GAS-23-202 |
337.4 |
340.0 |
2.3 |
3.7 |
|
GAS-23-203 |
327.3 |
332.3 |
4.4 |
4.9 |
|
GAS-23-204 |
341.6 |
352.7 |
9.1 |
6.4 |
|
GAS-23-205 |
358.0 |
364.0 |
4.4 |
4.0 |
|
419.0 |
423.0 |
2.9 |
2.0 |
||
GAS-23-206 |
369.0 |
374.0 |
3.5 |
0.9 |
|
GAS-23-208 |
374.0 |
379.0 |
4.1 |
11.2 |
|
GAS-23-209 |
426.0 |
430.0 |
2.9 |
2.3 |
|
GAS-23-210 |
357.0 |
358.6 |
1.4 |
4.5 |
|
GAS-23-211 |
385.0 |
388.0 |
1.9 |
0.7 |
|
406.4 |
411.6 |
3.3 |
1.5 |
||
GAS-23-213 |
383.6 |
388.6 |
3.9 |
2.3 |
|
GAS-23-214 |
349.1 |
352.0 |
2.4 |
2.1 |
|
GAS-23-216 |
341.0 |
344.0 |
2.4 |
0.2 |
|
381.0 |
386.0 |
4.1 |
3.9 |
||
GAS-23-217 |
290.0 |
297.0 |
6.4 |
11.3 |
|
GAS-23-218 |
379.8 |
387.0 |
4.7 |
0.5 |
|
431.1 |
434.0 |
1.9 |
3.6 |
||
GAS-23-219 |
243.5 |
251.0 |
5.8 |
0.2 |
|
GAS-23-221 |
407.0 |
414.0 |
5.5 |
1.6 |
|
GAS-23-226 |
357.0 |
361.1 |
3.2 |
2.3 |
|
GAS-23-227 |
348.0 |
352.0 |
3.0 |
0.1 |
|
GAS-23-228 |
304.6 |
311.4 |
5.4 |
0.1 |
|
GAS-23-229 |
313.4 |
317.0 |
2.5 |
6.5 |
|
GAS-23-230 |
360.0 |
362.3 |
1.5 |
2.0 |
|
GAS-23-231 |
317.3 |
319.9 |
2.2 |
11.7 |
|
GAS-23-232 |
193.6 |
201.1 |
6.4 |
0.1 |
|
GAS-23-233 |
205.5 |
211.3 |
4.8 |
0.1 |
|
GAS-23-234 |
229.0 |
263.0 |
24.9 |
2.4 |
|
GAS-23-235 |
260.0 |
270.0 |
6.8 |
4.6 |
|
GAS-23-236 |
201.0 |
207.0 |
5.2 |
3.5 |
|
GAS-23-237 |
217.0 |
223.4 |
5.5 |
1.0 |
|
GAS-23-238 |
216.3 |
230.0 |
10.9 |
5.4 |
|
GAS-23-240 |
112.0 |
118.3 |
4.5 |
2.7 |
|
150.0 |
161.0 |
7.8 |
5.5 |
||
GAS-23-241 |
117.0 |
120.0 |
2.5 |
15.2 |
|
GAS-23-242 |
155.0 |
160.0 |
3.9 |
1.9 |
|
GAS-23-243 |
193.0 |
202.0 |
5.5 |
26.0 |
|
GAS-23-244 |
106.0 |
109.0 |
1.4 |
0.5 |
|
158.0 |
166.0 |
3.7 |
2.8 |
||
GAS-23-245 |
138.0 |
143.0 |
3.7 |
4.9 |
|
GAS-23-246 |
158.0 |
169.8 |
8.3 |
2.0 |
|
GAS-23-247 |
128.6 |
139.1 |
8.8 |
5.5 |
|
GAS-23-248 |
222.6 |
226.6 |
3.2 |
1.5 |
|
GAS-23-249 |
193.0 |
201.6 |
7.6 |
2.4 |
|
GAS-23-250 |
235.0 |
248.0 |
10.6 |
0.7 |
|
GAS-23-252 |
262.0 |
286.5 |
18.8 |
4.1 |
|
GAS-23-253 |
210.6 |
218.0 |
5.8 |
2.2 |
|
GAS-23-254 |
221.0 |
225.0 |
3.1 |
2.7 |
|
GAS-23-255 |
85.0 |
90.0 |
2.2 |
0.9 |
|
GAS-23-256 |
99.0 |
101.0 |
0.9 |
2.9 |
|
GAS-23-259 |
117.0 |
121.0 |
1.2 |
1.9 |
|
196.0 |
198.0 |
0.6 |
6.3 |
||
GAS-23-261 |
170.0 |
173.1 |
1.9 |
2.1 |
|
GAS-23-262 |
172.1 |
177.8 |
4.9 |
2.3 |
|
GAS-23-263 |
218.0 |
224.0 |
5.3 |
3.2 |
|
GAS-23-264 |
400.5 |
407.0 |
4.5 |
3.0 |
|
GAS-23-265 |
406.0 |
411.0 |
4.0 |
5.7 |
|
GAS-23-266 |
376.0 |
380.0 |
2.9 |
1.5 |
|
GAS-23-267 |
353.0 |
355.7 |
2.2 |
0.8 |
|
GAS-23-268 |
335.0 |
338.0 |
2.5 |
5.8 |
|
GAS-23-269 |
426.0 |
428.0 |
1.4 |
0.7 |
|
GAS-23-272 |
397.0 |
402.0 |
3.5 |
1.4 |
|
442.0 |
445.0 |
2.1 |
1.2 |
||
GAS-23-273 |
341.4 |
347.0 |
5.2 |
5.1 |
|
GAS-23-274 |
378.5 |
389.0 |
8.9 |
2.1 |
|
GAS-23-275 |
438.0 |
447.0 |
6.7 |
1.7 |
|
GAS-23-278 |
487.0 |
496.3 |
6.5 |
1.9 |
|
GAS-23-281 |
239.0 |
241.9 |
2.2 |
6.7 |
|
GAS-23-283 |
190.0 |
195.0 |
4.4 |
19.0 |
|
GAS-23-285 |
314.4 |
317.4 |
1.9 |
0.4 |
|
GAS-23-287 |
176.0 |
178.0 |
1.9 |
0.2 |
|
GAS-23-288 |
290.0 |
294.0 |
2.8 |
1.9 |
|
GAS-23-289 |
242.0 |
249.0 |
5.6 |
46.1 |
|
GAS-23-291 |
352.8 |
355.0 |
1.7 |
1.0 |
|
GAS-23-300 |
169.5 |
170.8 |
0.9 |
2.8 |
|
Notes: All Porky West and Petunia drilling intercepts reflect true width intersections. Results are uncut, reported at a 0.3 g/t Au cut-off and include a maximum of three meters internal dilution.
Table 2: All drill holes completed at Cortaderas between April 2023 and September 2023. |
|||||||
Hole ID |
From
|
To
|
Interval
|
Ag
|
Pb
|
Zn
|
AgEq
|
DDH-400 |
158.0 |
180.0 |
22.0 |
5 |
0.0 |
1.6 |
56 |
Including |
158.0 |
164.0 |
6.0 |
3 |
0.0 |
2.5 |
85 |
|
201.0 |
224.0 |
23.0 |
22 |
0.1 |
2.5 |
101 |
Including |
203.0 |
208.0 |
5.0 |
27 |
0.2 |
3.5 |
141 |
|
271.0 |
279.0 |
8.0 |
100 |
0.1 |
8.1 |
342 |
Including |
271.0 |
276.0 |
5.0 |
142 |
0.1 |
11.5 |
487 |
|
284.0 |
303.0 |
19.0 |
34 |
0.0 |
2.9 |
121 |
Including |
286.0 |
293.0 |
7.0 |
71 |
0.0 |
5.6 |
239 |
|
345.0 |
349.0 |
4.0 |
38 |
0.0 |
2.9 |
126 |
385.0 |
389.0 |
4.0 |
3,325 |
0.1 |
0.7 |
2,719 |
|
Including |
386.0 |
388.0 |
2.0 |
6,517 |
0.2 |
1.0 |
5,319 |
|
395.0 |
412.0 |
17.0 |
65 |
0.1 |
1.4 |
100 |
427.0 |
431.0 |
4.0 |
30 |
0.0 |
1.2 |
65 |
|
596.0 |
629.0 |
33.0 |
391 |
0.0 |
2.2 |
388 |
|
Including |
608.0 |
623.0 |
15.0 |
811 |
0.0 |
2.4 |
737 |
Including |
613.0 |
623.0 |
10.0 |
1,098 |
0.1 |
3.5 |
1,005 |
|
633.0 |
645.0 |
12.0 |
24 |
0.1 |
2.0 |
87 |
DDH-401 |
172.0 |
182.0 |
10.0 |
44 |
0.0 |
2.9 |
131 |
197.0 |
203.0 |
6.0 |
25 |
0.1 |
1.9 |
85 |
|
244.0 |
260.0 |
16.0 |
83 |
0.2 |
4.5 |
216 |
|
342.0 |
346.0 |
4.0 |
360 |
0.0 |
1.1 |
329 |
|
Including |
344.0 |
345.0 |
1.0 |
1,127 |
0.1 |
2.4 |
993 |
|
351.0 |
357.0 |
6.0 |
58 |
0.1 |
2.1 |
119 |
417.0 |
420.0 |
3.0 |
42 |
0.1 |
5.0 |
198 |
|
527.0 |
543.0 |
16.0 |
74 |
0.1 |
3.3 |
169 |
|
Including |
540.0 |
542.0 |
2.0 |
288 |
0.3 |
5.1 |
408 |
DDH-402 |
88.0 |
94.0 |
6.0 |
31 |
0.3 |
3.8 |
156 |
Including |
89.0 |
91.0 |
2.0 |
58 |
0.7 |
7.5 |
310 |
|
147.0 |
152.0 |
5.0 |
34 |
0.1 |
5.1 |
194 |
Including |
147.0 |
149.0 |
2.0 |
67 |
0.1 |
11.1 |
417 |
|
170.0 |
173.0 |
3.0 |
86 |
0.1 |
6.8 |
291 |
187.0 |
203.0 |
16.0 |
51 |
0.3 |
4.5 |
196 |
|
208.0 |
229.0 |
21.0 |
46 |
0.1 |
4.7 |
191 |
|
Including |
215.0 |
225.0 |
10.0 |
76 |
0.1 |
7.6 |
311 |
|
256.0 |
259.0 |
3.0 |
21 |
0.0 |
2.0 |
81 |
273.0 |
278.0 |
5.0 |
55 |
0.2 |
5.5 |
227 |
|
296.0 |
303.0 |
7.0 |
32 |
0.0 |
3.0 |
123 |
|
DDH-403 |
281.0 |
287.0 |
6.0 |
63 |
0.3 |
7.4 |
297 |
Including |
281.0 |
282.0 |
1.0 |
249 |
0.1 |
25.1 |
1,015 |
|
307.0 |
310.0 |
3.0 |
11 |
0.7 |
3.4 |
140 |
317.0 |
320.0 |
3.0 |
21 |
1.7 |
9.3 |
368 |
|
329.0 |
340.0 |
11.0 |
35 |
0.3 |
5.5 |
215 |
|
DDH-404 |
258.0 |
270.0 |
12.0 |
29 |
0.0 |
3.6 |
140 |
300.0 |
332.0 |
32.0 |
49 |
0.2 |
7.7 |
296 |
|
Including |
309.0 |
313.0 |
4.0 |
221 |
1.4 |
35.7 |
1,374 |
And Including |
327.0 |
329.0 |
2.0 |
134 |
0.2 |
17.3 |
673 |
|
360.0 |
365.0 |
5.0 |
3 |
0.1 |
0.6 |
147 |
492.0 |
507.0 |
15.0 |
69 |
0.0 |
1.4 |
102 |
|
515.0 |
534.0 |
19.0 |
37 |
0.0 |
2.0 |
94 |
|
538.0 |
546.0 |
8.0 |
53 |
0.1 |
2.9 |
139 |
|
552.0 |
558.9 |
6.9 |
21 |
0.1 |
2.4 |
99 |
|
DDH-405 |
129.0 |
133.0 |
4.0 |
29 |
0.1 |
3.3 |
135 |
181.0 |
198.0 |
17.0 |
38 |
0.1 |
2.8 |
124 |
|
Including |
189.0 |
192.0 |
3.0 |
129 |
0.4 |
7.6 |
362 |
|
222.0 |
229.0 |
7.0 |
15 |
0.1 |
1.6 |
66 |
289.0 |
292.0 |
3.0 |
38 |
0.1 |
3.2 |
135 |
|
312.0 |
335.0 |
23.0 |
220 |
0.2 |
3.2 |
251 |
|
Including |
315.6 |
322.4 |
6.8 |
193 |
0.7 |
8.2 |
330 |
|
471.0 |
480.0 |
9.0 |
25 |
0.0 |
1.8 |
81 |
495.0 |
540.0 |
45.0 |
198 |
0.1 |
4.0 |
291 |
|
Including |
507.0 |
518.0 |
11.0 |
639 |
0.2 |
7.1 |
753 |
Including |
507.0 |
508.9 |
1.9 |
2,442 |
0.8 |
17.5 |
2,565 |
|
563.0 |
569.0 |
6.0 |
12 |
0.3 |
2.8 |
107 |
DDH-406 |
230.0 |
420.0 |
190.0 |
155 |
0.3 |
10.6 |
479 |
Including |
276.0 |
329.3 |
53.3 |
332 |
0.5 |
22.8 |
1,020 |
And Including |
374.4 |
383.4 |
9.0 |
406 |
0.2 |
26.7 |
1,195 |
|
426.0 |
440.0 |
14.0 |
36 |
0.1 |
3.6 |
147 |
DDH-413 |
165.2 |
169.0 |
3.8 |
19 |
0.9 |
4.4 |
185 |
287.0 |
297.0 |
10.0 |
11 |
0.3 |
1.9 |
81 |
|
303.0 |
376.0 |
73.0 |
26 |
0.0 |
3.9 |
149 |
|
334.0 |
352.0 |
18.0 |
54 |
0.0 |
6.3 |
248 |
|
DDH-421 |
116.6 |
124.0 |
7.4 |
241 |
0.4 |
7.7 |
393 |
Notes: Significant intervals are reported using a 50 grams per tonne (g/t) silver equivalent (AgEq) cut-off and with a maximum 3 meters of contiguous dilution. All intercepts are core width intervals.
Silver equivalent values are calculated using the following metal prices: Silver (Ag) price of $22 per troy ounce, Lead (Pb) price of $0.95 per pound, and Zinc (Zn) price of $1.15 per pound. Metallurgical recoveries for the Cortaderas deposit were used in the calculation of AgEq values (recoveries at Cortaderas are assumed at 81% for silver, 100% for lead and 90% for zinc).
Figures presented in this table may not add due to rounding.
Table 3: All drill holes completed from Hod Maden infill drilling campaign as of September 30, 2023. |
||||||
Hole ID |
From
|
To
|
Interval
|
Au
|
Cu
|
End of Hole
|
HTD-238 |
256 |
282 |
26 |
18.5 |
3.24 |
449 |
Including |
259 |
275 |
16 |
27.0 |
3.74 |
|
|
304 |
311 |
7 |
1.0 |
1.35 |
|
327 |
340 |
13 |
2.9 |
1.33 |
||
Including |
327 |
328 |
1 |
17.0 |
1.34 |
|
|
347 |
350 |
3 |
1.5 |
1.19 |
|
354 |
372 |
18 |
2.9 |
1.92 |
||
HTD-239 |
162 |
252 |
90 |
16.5 |
1.56 |
314 |
Including |
162 |
180 |
18 |
63.0 |
2.02 |
|
HTD-240 |
174 |
177 |
3 |
1.3 |
0.89 |
280 |
195 |
256 |
61 |
18.8 |
2.26 |
||
Including |
197 |
230 |
33 |
30.8 |
2.86 |
|
Notes: All Hod Maden drilling intercepts reflect core length intersections. Results are uncut, reported at a 1 g/t Au cut-off and include a maximum of three meters internal dilution.
Figures presented in this table may not add due to rounding.
Cautionary Note Regarding Forward-Looking Information and Statements:
Except for statements of historical fact relating to us, certain statements contained in this news release constitute forward-looking information, future oriented financial information, or financial outlooks (collectively “forward-looking information”) within the meaning of applicable securities laws. Forward-looking information may be contained in this document and our other public filings. Forward-looking information relates to statements concerning our outlook and anticipated events or results and, in some cases, can be identified by terminology such as “may”, “will”, “could”, “should”, “expect”, “plan”, “anticipate”, “believe”, “intend”, “estimate”, “projects”, “predict”, “potential”, “continue” or other similar expressions concerning matters that are not historical facts.
Forward-looking information and statements in this news release are based on certain key expectations and assumptions made by us. Although we believe that the expectations and assumptions on which such forward-looking information and statements are based are reasonable, undue reliance should not be placed on the forward-looking information and statements because we can give no assurance that they will prove to be correct. Forward-looking information and statements are subject to various risks and uncertainties which could cause actual results and experience to differ materially from the anticipated results or expectations expressed in this news release. The key risks and uncertainties include, but are not limited to: local and global political and economic conditions; governmental and regulatory requirements and actions by governmental authorities, including changes in government policy, government ownership requirements, changes in environmental, tax and other laws or regulations and the interpretation thereof; developments with respect to global pandemics, including the duration, severity and scope of a pandemic and potential impacts on mining operations; and other risk factors detailed from time to time in our reports filed with the Securities and Exchange Commission on EDGAR and the Canadian securities regulatory authorities on SEDAR.
Forward-looking information and statements in this news release include any statements concerning, among other things: forecasts and outlook; preliminary cost reporting in this document; timing, production, operating, cost, and capital expenditure guidance; our operational and development targets and catalysts and the impact of any suspensions on operations; the results of any gold reconciliations; the ability to discover additional oxide gold ore; the generation of free cash flow and payment of dividends; matters relating to proposed exploration; communications with local stakeholders; maintaining community and government relations; negotiations of joint ventures; negotiation and completion of transactions; commodity prices; Mineral Resources, Mineral Reserves, conversion of Mineral Resources, realization of Mineral Reserves, and the existence or realization of Mineral Resource estimates; the development approach; the timing and amount of future production; the timing of studies, announcements, and analysis; the timing of construction and development of proposed mines and process facilities; capital and operating expenditures; economic conditions; availability of sufficient financing; exploration plans; receipt of regulatory approvals; timing and impact surrounding suspension or interruption of operations as a result of regulatory requirements or actions by governmental authority; renewal of NCIB program; and any and all other timing, exploration, development, operational, financial, budgetary, economic, legal, social, environmental, regulatory, and political matters that may influence or be influenced by future events or conditions.
Such forward-looking information and statements are based on a number of material factors and assumptions, including, but not limited in any manner to, those disclosed in any other of our filings on EDGAR and SEDAR, and include: the inherent speculative nature of exploration results; the ability to explore; communications with local stakeholders; maintaining community and governmental relations; status of negotiations of joint ventures; weather conditions at our operations; commodity prices; the ultimate determination of and realization of Mineral Reserves; existence or realization of Mineral Resources; the development approach; availability and receipt of required approvals, titles, licenses and permits; sufficient working capital to develop and operate the mines and implement development plans; access to adequate services and supplies; foreign currency exchange rates; interest rates; access to capital markets and associated cost of funds; availability of a qualified work force; ability to negotiate, finalize, and execute relevant agreements; lack of social opposition to our mines or facilities; lack of legal challenges with respect to our properties; the timing and amount of future production; the ability to meet production, cost, and capital expenditure targets; timing and ability to produce studies and analyses; capital and operating expenditures; economic conditions; availability of sufficient financing; the ultimate ability to mine, process, and sell mineral products on economically favorable terms; and any and all other timing, exploration, development, operational, financial, budgetary, economic, legal, social, geopolitical, regulatory and political factors that may influence future events or conditions. While we consider these factors and assumptions to be reasonable based on information currently available to us, they may prove to be incorrect.
The above list is not exhaustive of the factors that may affect any of the Company’s forward-looking information. You should not place undue reliance on forward-looking information and statements. Forward-looking information and statements are only predictions based on our current expectations and our projections about future events. Actual results may vary from such forward-looking information for a variety of reasons including, but not limited to, risks and uncertainties disclosed in our filings on our website at www.ssrmining.com, on SEDAR at www.sedarplus.ca, on EDGAR at www.sec.gov and on the ASX at www.asx.com.au and other unforeseen events or circumstances. Other than as required by law, we do not intend, and undertake no obligation to update any forward-looking information to reflect, among other things, new information or future events. The information contained on, or that may be accessed through, our website is not incorporated by reference into, and is not a part of, this document.
Qualified Persons
The scientific and technical information concerning our mineral projects in this news release have been reviewed and approved by a “qualified person” under S-K 1300. For details on the “qualified persons” approving such information, a description of the key assumptions, parameters and methods used to estimate mineral reserves and mineral resources for SSR Mining Inc.’s material properties included in this news release, as well as data verification procedures and a general discussion of the extent to which the estimates may be affected by any known environmental, permitting, legal, title, taxation, sociopolitical, marketing or other relevant factors, please review the Technical Report Summaries for each of the Company’s material properties which are available at www.sec.gov.
Cautionary Note to U.S. Investors
This news release includes terms that comply with reporting standards in Canada under National Instrument 43-101 – Standards of Disclosure for Mineral Projects (“NI 43-101”), including the terms “Mineral Reserves” and “Mineral Resources”. NI 43-101 is a rule developed by the Canadian Securities Administrators that establishes standards for all public disclosure an issuer makes of scientific and technical information concerning mineral projects. The standards of NI 43-101 differ significantly from the requirements of the SEC. Accordingly, information concerning mineral deposits set forth herein may not be comparable with information made in accordance with U.S. standards.
Cautionary Note Regarding Non-GAAP Financial Measures
We have included certain non-GAAP financial measures to assist in understanding the Company’s financial results. The non-GAAP financial measures are employed by us to measure our operating and economic performance and to assist in decision-making, as well as to provide key performance information to senior management. We believe that, in addition to conventional measures prepared in accordance with GAAP, certain investors and other stakeholders will find this information useful to evaluate our operating and financial performance; however, these non-GAAP performance measures do not have any standardized meaning. These performance measures are intended to provide additional information and should not be considered in isolation or as a substitute for measures of performance prepared in accordance with GAAP. Our definitions of our non-GAAP financial measures may not be comparable to similarly titled measures reported by other companies. These non-GAAP measures should be read in conjunction with our consolidated financial statements.
Cash costs, AISC per ounce sold, adjusted attributable net income (loss), free cash flow, and net cash are Non-GAAP Measures with no standardized definition under U.S GAAP.
Non-GAAP Measure – Net Cash and Liquidity
Net cash and net debt are used by management and investors to measure the Company's underlying operating performance. The Company believes that net cash is a useful measure for shareholders as it helps evaluate liquidity and available cash.
The following table provides a reconciliation of cash and cash equivalents to net cash:
|
As of |
|||||
(in thousands) |
|
September 30, 2023 |
|
December 31, 2022 |
||
Cash and cash equivalents |
|
$ |
437,675 |
|
$ |
655,453 |
Restricted cash |
|
$ |
100 |
|
$ |
33,653 |
Total cash |
|
$ |
437,775 |
|
$ |
689,106 |
|
|
|
|
|
|
|
Short and long term portion of term loan |
|
$ |
— |
|
$ |
70,000 |
Face value of 2019 convertible note |
|
$ |
230,000 |
|
$ |
230,000 |
Other debt |
|
$ |
906 |
|
$ |
1,797 |
Total debt |
|
$ |
230,906 |
|
$ |
301,797 |
|
|
|
|
|
|
|
Net cash (debt) |
|
$ |
206,869 |
|
$ |
387,309 |
In addition to net cash and net debt, the Company also uses Total liquidity to measure its financial position. Total liquidity is calculated as Cash and cash equivalents plus Restricted cash and borrowing capacity under current revolving credit facilities, including accordion features. As of September 30, 2023, no borrowings were outstanding on the Company’s $400 million credit facility with a $100 million accordion feature.
The following table provides a reconciliation of Cash and cash equivalents to Total liquidity:
|
As of |
|||||
(in thousands) |
|
September 30, 2023 |
|
December 31, 2022 |
||
Cash and cash equivalents |
|
$ |
437,675 |
|
$ |
655,453 |
Restricted cash |
|
$ |
100 |
|
$ |
33,653 |
Total cash |
|
$ |
437,775 |
|
$ |
689,106 |
Borrowing capacity on credit facility |
|
$ |
400,000 |
|
$ |
200,000 |
Borrowing capacity on accordion feature of credit facility |
|
$ |
100,000 |
|
$ |
100,000 |
Total liquidity |
|
$ |
937,775 |
|
$ |
989,106 |
Non-GAAP Measure - Cash Costs and AISC
The Company uses cash costs per ounce of precious metals sold to monitor its operating performance internally. The most directly comparable measure prepared in accordance with GAAP is Cost of sales. The Company believes this measure provides investors and analysts with useful information about its underlying cash costs of operations and the impact of by-product credits on its cost structure. The Company also believes it is a relevant metric used to understand its operating profitability and ability to generate cash flow. When deriving the Cost of sales associated with an ounce of precious metal, the Company includes by-product credits. Thereby allowing management and other stakeholders to assess the net costs of gold and silver production. In calculating cash costs per ounce, the Company also excludes the impact of specific items that are significant, but not reflective of its underlying operations.
AISC includes total Cost of sales incurred at the Company's mining operations, which forms the basis of cash costs. Additionally, the Company includes sustaining capital expenditures, sustaining mine-site exploration and evaluation costs, reclamation cost accretion and amortization, and general and administrative expenses. This measure seeks to reflect the ongoing cost of gold and silver production from current operations; therefore, expansionary capital and non-sustaining expenditures are excluded. Certain other cash expenditures, including tax payments and financing costs are also excluded.
The Company believes that AISC represents the total costs of producing gold and silver from current operations and provides the Company and other stakeholders with additional information about its operating performance and ability to generate cash flows. It allows the Company to assess its ability to support capital expenditures and to sustain future production from the generation of operating cash flows.
When deriving the number of ounces of precious metal sold, the Company considers the physical ounces available for sale after the treatment and refining process, commonly referred to as payable metal, as this is what is sold to third parties.
The following tables provide a reconciliation of Cost of sales to Cash costs and AISC:
|
|
Three Months Ended September 30, 2023 |
|||||||||||||||||||||
(in thousands, unless otherwise noted) |
|
Çöpler |
|
Marigold |
|
Seabee |
|
Puna |
|
Corporate |
|
Total |
|||||||||||
Cost of sales (GAAP) (11) |
|
$ |
69,830 |
|
|
$ |
81,464 |
|
|
$ |
19,939 |
|
|
$ |
43,437 |
|
|
$ |
— |
|
$ |
214,670 |
|
By-product credits |
|
$ |
(1,307 |
) |
|
$ |
(26 |
) |
|
$ |
(16 |
) |
|
$ |
(12,987 |
) |
|
$ |
— |
|
$ |
(14,336 |
) |
Treatment and refining charges |
|
$ |
— |
|
|
$ |
50 |
|
|
$ |
24 |
|
|
$ |
4,717 |
|
|
$ |
— |
|
$ |
4,791 |
|
Cash costs (non-GAAP) |
|
$ |
68,523 |
|
|
$ |
81,488 |
|
|
$ |
19,947 |
|
|
$ |
35,167 |
|
|
$ |
— |
|
$ |
205,125 |
|
Sustaining capital expenditures |
|
$ |
9,100 |
|
|
$ |
8,683 |
|
|
$ |
6,212 |
|
|
$ |
4,593 |
|
|
$ |
— |
|
$ |
28,588 |
|
Sustaining exploration and evaluation
|
|
$ |
1,156 |
|
|
$ |
1,009 |
|
|
$ |
— |
|
|
$ |
(3,371 |
) |
|
$ |
— |
|
$ |
(1,206 |
) |
Reclamation cost accretion and amortization |
|
$ |
427 |
|
|
$ |
708 |
|
|
$ |
692 |
|
|
$ |
765 |
|
|
$ |
— |
|
$ |
2,592 |
|
General and administrative expense and
|
|
$ |
1,668 |
|
|
$ |
— |
|
|
$ |
— |
|
|
$ |
43 |
|
|
$ |
15,853 |
|
$ |
17,564 |
|
Total AISC (non-GAAP) |
|
$ |
80,874 |
|
|
$ |
91,888 |
|
|
$ |
26,851 |
|
|
$ |
37,197 |
|
|
$ |
15,853 |
|
$ |
252,663 |
|
|
|
|
|
|
|
|
|
|
|
|
|
|
|||||||||||
Gold sold (oz) |
|
|
58,694 |
|
|
|
83,103 |
|
|
|
19,430 |
|
|
|
— |
|
|
|
— |
|
|
161,227 |
|
Silver sold (oz) |
|
|
— |
|
|
|
— |
|
|
|
— |
|
|
|
2,852,065 |
|
|
|
— |
|
|
2,852,065 |
|
Gold equivalent sold (oz) (12) |
|
|
58,694 |
|
|
|
83,103 |
|
|
|
19,430 |
|
|
|
34,861 |
|
|
|
— |
|
|
196,088 |
|
|
|
|
|
|
|
|
|
|
|
|
|
|
|||||||||||
Cost of sales per gold equivalent ounce sold |
|
|
1,190 |
|
|
|
980 |
|
|
|
1,026 |
|
|
|
1,246 |
|
|
|
N/A |
|
|
1,095 |
|
Cash cost per gold ounce sold |
|
|
1,167 |
|
|
|
981 |
|
|
|
1,027 |
|
|
|
N/A |
|
|
|
N/A |
|
|
N/A |
|
Cash cost per silver ounce sold |
|
|
N/A |
|
|
|
N/A |
|
|
|
N/A |
|
|
|
12.33 |
|
|
|
N/A |
|
|
N/A |
|
Cash cost per gold equivalent ounce sold |
|
|
1,167 |
|
|
|
981 |
|
|
|
1,027 |
|
|
|
1,009 |
|
|
|
N/A |
|
|
1,046 |
|
AISC per gold ounce sold |
|
|
1,378 |
|
|
|
1,106 |
|
|
|
1,382 |
|
|
|
N/A |
|
|
|
N/A |
|
|
N/A |
|
AISC per silver ounce sold |
|
|
N/A |
|
|
|
N/A |
|
|
|
N/A |
|
|
|
13.04 |
|
|
|
N/A |
|
|
N/A |
|
AISC per gold equivalent ounce sold |
|
|
1,378 |
|
|
|
1,106 |
|
|
|
1,382 |
|
|
|
1,067 |
|
|
|
N/A |
|
|
1,289 |
|
|
|
Three Months Ended September 30, 2022 |
||||||||||||||||||||
(in thousands, unless otherwise noted) |
|
Çöpler |
|
Marigold |
|
Seabee |
|
Puna |
|
Corporate |
|
Total |
||||||||||
Cost of sales (GAAP) (11) |
|
$ |
306 |
|
$ |
53,684 |
|
|
$ |
17,894 |
|
|
$ |
34,568 |
|
|
$ |
— |
|
$ |
106,452 |
|
By-product credits |
|
$ |
5 |
|
$ |
(33 |
) |
|
$ |
(21 |
) |
|
$ |
(8,448 |
) |
|
$ |
— |
|
$ |
(8,497 |
) |
Treatment and refining charges |
|
$ |
— |
|
$ |
123 |
|
|
$ |
56 |
|
|
$ |
3,663 |
|
|
$ |
— |
|
$ |
3,842 |
|
Cash costs (non-GAAP) |
|
$ |
311 |
|
$ |
53,774 |
|
|
$ |
17,929 |
|
|
$ |
29,783 |
|
|
$ |
— |
|
$ |
101,797 |
|
Sustaining capital expenditures |
|
$ |
6,299 |
|
$ |
15,881 |
|
|
$ |
7,055 |
|
|
$ |
3,445 |
|
|
$ |
— |
|
$ |
32,680 |
|
Sustaining exploration and evaluation expense |
|
$ |
383 |
|
$ |
1,626 |
|
|
$ |
— |
|
|
$ |
1,820 |
|
|
$ |
— |
|
$ |
3,829 |
|
Care and maintenance (14) |
|
$ |
31,067 |
|
$ |
— |
|
|
$ |
— |
|
|
$ |
— |
|
|
$ |
— |
|
$ |
31,067 |
|
Reclamation cost accretion and amortization |
|
$ |
415 |
|
$ |
526 |
|
|
$ |
703 |
|
|
$ |
432 |
|
|
$ |
— |
|
$ |
2,076 |
|
General and administrative expense and
|
|
$ |
215 |
|
$ |
— |
|
|
$ |
— |
|
|
$ |
70 |
|
|
$ |
12,429 |
|
$ |
12,714 |
|
Total AISC (non-GAAP) |
|
$ |
38,690 |
|
$ |
71,807 |
|
|
$ |
25,687 |
|
|
$ |
35,550 |
|
|
$ |
12,429 |
|
$ |
184,163 |
|
|
|
|
|
|
|
|
|
|
|
|
|
|
||||||||||
Gold sold (oz) |
|
|
2,591 |
|
|
49,744 |
|
|
|
19,700 |
|
|
|
— |
|
|
|
— |
|
|
72,035 |
|
Silver sold (oz) |
|
|
— |
|
|
— |
|
|
|
— |
|
|
|
2,234,323 |
|
|
|
— |
|
|
2,234,323 |
|
Gold equivalent sold (oz) (12) |
|
|
2,591 |
|
|
49,744 |
|
|
|
19,700 |
|
|
|
24,850 |
|
|
|
— |
|
|
96,885 |
|
|
|
|
|
|
|
|
|
|
|
|
|
|
||||||||||
Cost of sales per gold equivalent ounce sold |
|
|
118 |
|
|
1,079 |
|
|
|
908 |
|
|
|
1,391 |
|
|
|
N/A |
|
|
1,099 |
|
Cash cost per gold ounce sold |
|
|
160 |
|
|
1,081 |
|
|
|
910 |
|
|
|
N/A |
|
|
|
N/A |
|
|
N/A |
|
Cash cost per silver ounce sold |
|
|
N/A |
|
|
N/A |
|
|
|
N/A |
|
|
|
13.33 |
|
|
|
N/A |
|
|
N/A |
|
Cash cost per gold equivalent ounce sold |
|
|
160 |
|
|
1,081 |
|
|
|
910 |
|
|
|
1,199 |
|
|
|
N/A |
|
|
1,051 |
|
AISC per gold ounce sold |
|
|
14,972 |
|
|
1,444 |
|
|
|
1,304 |
|
|
|
N/A |
|
|
|
N/A |
|
|
N/A |
|
AISC per silver ounce sold |
|
|
N/A |
|
|
N/A |
|
|
|
N/A |
|
|
|
15.91 |
|
|
|
N/A |
|
|
N/A |
|
AISC per gold equivalent ounce sold |
|
|
14,972 |
|
|
1,444 |
|
|
|
1,304 |
|
|
|
1,431 |
|
|
|
N/A |
|
|
1,901 |
|
(11) Excludes depreciation, depletion, and amortization.
(12) Gold equivalent ounces are calculated by multiplying the silver ounces by the ratio of the silver price to the gold price, using the average LBMA prices for the period. The Company does not include by-products in the gold equivalent ounce calculations. Gold equivalent ounces sold may not add based on amounts presented in this table due to rounding.
(13) During the three months ended September 30, 2023, the Company reclassified Sustaining exploration and evaluation expense to Sustaining capital expenditures at Puna. These costs had been appropriately capitalized in prior periods, but had been reported as expense rather than capital in the AISC table. The update to the presentation for these costs did not impact the AISC per ounce calculation.
(14) Care and maintenance expense in the AISC calculation only includes direct costs, as depreciation is not included in the calculation of AISC.
|
|
Nine Months Ended September 30, 2023 |
|||||||||||||||||||||
(in thousands, unless otherwise noted) |
|
Çöpler |
|
Marigold |
|
Seabee |
|
Puna |
|
Corporate |
|
Total |
|||||||||||
Cost of sales (GAAP) (15) |
|
$ |
199,425 |
|
|
$ |
199,970 |
|
|
$ |
61,476 |
|
|
$ |
123,736 |
|
|
$ |
— |
|
$ |
584,607 |
|
By-product credits |
|
$ |
(2,674 |
) |
|
$ |
(99 |
) |
|
$ |
(41 |
) |
|
$ |
(41,463 |
) |
|
$ |
— |
|
$ |
(44,277 |
) |
Treatment and refining charges |
|
$ |
— |
|
|
$ |
509 |
|
|
$ |
73 |
|
|
$ |
13,964 |
|
|
$ |
— |
|
$ |
14,546 |
|
Cash costs (non-GAAP) |
|
$ |
196,751 |
|
|
$ |
200,380 |
|
|
$ |
61,508 |
|
|
$ |
96,237 |
|
|
$ |
— |
|
$ |
554,876 |
|
Sustaining capital expenditures |
|
$ |
26,313 |
|
|
$ |
73,994 |
|
|
$ |
26,220 |
|
|
$ |
9,900 |
|
|
$ |
— |
|
$ |
136,427 |
|
Sustaining exploration and evaluation expense |
|
$ |
3,271 |
|
|
$ |
815 |
|
|
$ |
— |
|
|
$ |
— |
|
|
$ |
— |
|
$ |
4,086 |
|
Reclamation cost accretion and amortization |
|
$ |
1,282 |
|
|
$ |
2,019 |
|
|
$ |
2,108 |
|
|
$ |
2,295 |
|
|
$ |
— |
|
$ |
7,704 |
|
General and administrative expense and stock-
|
|
$ |
4,095 |
|
|
$ |
— |
|
|
$ |
— |
|
|
$ |
132 |
|
|
$ |
48,139 |
|
$ |
52,366 |
|
Total AISC (non-GAAP) |
|
$ |
231,712 |
|
|
$ |
277,208 |
|
|
$ |
89,836 |
|
|
$ |
108,564 |
|
|
$ |
48,139 |
|
$ |
755,459 |
|
|
|
|
|
|
|
|
|
|
|
|
|
|
|||||||||||
Gold sold (oz) |
|
|
165,905 |
|
|
|
194,789 |
|
|
|
51,560 |
|
|
|
— |
|
|
|
— |
|
|
412,254 |
|
Silver sold (oz) |
|
|
— |
|
|
|
— |
|
|
|
— |
|
|
|
7,090,205 |
|
|
|
— |
|
|
7,090,205 |
|
Gold equivalent sold (oz) (16) |
|
|
165,905 |
|
|
|
194,789 |
|
|
|
51,560 |
|
|
|
86,030 |
|
|
|
— |
|
|
498,284 |
|
|
|
|
|
|
|
|
|
|
|
|
|
|
|||||||||||
Cost of sales per gold equivalent ounce sold |
|
|
1,202 |
|
|
|
1,027 |
|
|
|
1,192 |
|
|
|
1,438 |
|
|
|
N/A |
|
|
1,173 |
|
Cash cost per gold ounce sold |
|
|
1,186 |
|
|
|
1,029 |
|
|
|
1,193 |
|
|
|
N/A |
|
|
|
N/A |
|
|
N/A |
|
Cash cost per silver ounce sold |
|
|
N/A |
|
|
|
N/A |
|
|
|
N/A |
|
|
|
13.57 |
|
|
|
N/A |
|
|
N/A |
|
Cash cost per gold equivalent ounce sold |
|
|
1,186 |
|
|
|
1,029 |
|
|
|
1,193 |
|
|
|
1,119 |
|
|
|
N/A |
|
|
1,114 |
|
AISC per gold ounce sold |
|
|
1,397 |
|
|
|
1,423 |
|
|
|
1,742 |
|
|
|
N/A |
|
|
|
N/A |
|
|
N/A |
|
AISC per silver ounce sold |
|
|
N/A |
|
|
|
N/A |
|
|
|
N/A |
|
|
|
15.31 |
|
|
|
N/A |
|
|
N/A |
|
AISC per gold equivalent ounce sold |
|
|
1,397 |
|
|
|
1,423 |
|
|
|
1,742 |
|
|
|
1,262 |
|
|
|
N/A |
|
|
1,516 |
|
|
|
Nine Months Ended September 30, 2022 |
|||||||||||||||||||||
(in thousands, unless otherwise noted) |
|
Çöpler |
|
Marigold |
|
Seabee |
|
Puna |
|
Corporate |
|
Total |
|||||||||||
Cost of sales (GAAP) (15) |
|
$ |
125,985 |
|
|
$ |
142,841 |
|
|
$ |
53,319 |
|
|
$ |
102,755 |
|
|
$ |
— |
|
$ |
424,900 |
|
By-product credits |
|
$ |
(2,726 |
) |
|
$ |
(96 |
) |
|
$ |
(97 |
) |
|
$ |
(37,017 |
) |
|
$ |
— |
|
$ |
(39,936 |
) |
Treatment and refining charges |
|
$ |
— |
|
|
$ |
301 |
|
|
$ |
262 |
|
|
$ |
11,029 |
|
|
$ |
— |
|
$ |
11,592 |
|
Cash costs (non-GAAP) |
|
$ |
123,259 |
|
|
$ |
143,046 |
|
|
$ |
53,484 |
|
|
$ |
76,767 |
|
|
$ |
— |
|
$ |
396,556 |
|
Sustaining capital expenditures |
|
$ |
20,778 |
|
|
$ |
45,431 |
|
|
$ |
26,316 |
|
|
$ |
8,085 |
|
|
$ |
— |
|
$ |
100,610 |
|
Sustaining exploration and evaluation expense |
|
$ |
2,111 |
|
|
$ |
6,577 |
|
|
$ |
— |
|
|
$ |
1,984 |
|
|
$ |
— |
|
$ |
10,672 |
|
Care and maintenance (17) |
|
$ |
31,067 |
|
|
$ |
— |
|
|
$ |
— |
|
|
$ |
— |
|
|
$ |
— |
|
$ |
31,067 |
|
Reclamation cost accretion and amortization |
|
$ |
677 |
|
|
$ |
1,596 |
|
|
$ |
1,053 |
|
|
$ |
1,295 |
|
|
$ |
— |
|
$ |
4,621 |
|
General and administrative expense and stock-
|
|
$ |
1,670 |
|
|
$ |
1 |
|
|
$ |
11 |
|
|
$ |
233 |
|
|
$ |
46,507 |
|
$ |
48,422 |
|
Total AISC (non-GAAP) |
|
$ |
179,562 |
|
|
$ |
196,651 |
|
|
$ |
80,864 |
|
|
$ |
88,364 |
|
|
$ |
46,507 |
|
$ |
591,948 |
|
|
|
|
|
|
|
|
|
|
|
|
|
|
|||||||||||
Gold sold (oz) |
|
|
132,862 |
|
|
|
132,681 |
|
|
|
110,000 |
|
|
|
— |
|
|
|
— |
|
|
375,543 |
|
Silver sold (oz) |
|
|
— |
|
|
|
— |
|
|
|
— |
|
|
|
5,766,165 |
|
|
|
— |
|
|
5,766,165 |
|
Gold equivalent sold (oz) (16) |
|
|
132,862 |
|
|
|
132,681 |
|
|
|
110,000 |
|
|
|
69,284 |
|
|
|
— |
|
|
444,827 |
|
|
|
|
|
|
|
|
|
|
|
|
|
|
|||||||||||
Cost of sales per gold equivalent ounce sold |
|
|
948 |
|
|
|
1,077 |
|
|
|
485 |
|
|
|
1,483 |
|
|
|
N/A |
|
|
955 |
|
Cash cost per gold ounce sold |
|
|
928 |
|
|
|
1,078 |
|
|
|
486 |
|
|
|
N/A |
|
|
|
N/A |
|
|
N/A |
|
Cash cost per silver ounce sold |
|
|
N/A |
|
|
|
N/A |
|
|
|
N/A |
|
|
|
13.31 |
|
|
|
N/A |
|
|
N/A |
|
Cash cost per gold equivalent ounce sold |
|
|
928 |
|
|
|
1,078 |
|
|
|
486 |
|
|
|
1,108 |
|
|
|
N/A |
|
|
891 |
|
AISC per gold ounce sold |
|
|
1,351 |
|
|
|
1,482 |
|
|
|
735 |
|
|
|
N/A |
|
|
|
N/A |
|
|
N/A |
|
AISC per silver ounce sold |
|
|
N/A |
|
|
|
N/A |
|
|
|
N/A |
|
|
|
15.32 |
|
|
|
N/A |
|
|
N/A |
|
AISC per gold equivalent ounce sold |
|
|
1,351 |
|
|
|
1,482 |
|
|
|
735 |
|
|
|
1,275 |
|
|
|
N/A |
|
|
1,331 |
|
(15) Excludes depreciation, depletion, and amortization.
(16) Gold equivalent ounces are calculated by multiplying the silver ounces by the ratio of the silver price to the gold price, using the average LBMA prices for the period. The Company does not include by-products in the gold equivalent ounce calculations. Gold equivalent ounces sold may not add based on amounts presented in this table due to rounding.
(17) Care and maintenance expense in the AISC calculation only includes direct costs, as depreciation is not included in the calculation of AISC.
Non-GAAP Measure - Adjusted Attributable Net Income (loss)
Adjusted attributable net income (loss) and adjusted attributable net income (loss) per share are used by management to measure the Company's underlying operating performance. We believe this measure is also useful for shareholders to assess the Company’s operating performance. The most directly comparable financial measures prepared in accordance with GAAP are Net income (loss) attributable to SSR Mining shareholders and Net income (loss) per share attributable to SSR Mining shareholders. Adjusted attributable net income (loss) is defined as net income (loss) adjusted to exclude the after-tax impact of specific items that are significant, but not reflective of the Company's underlying operations, including impairment charges; inflationary impacts on tax balances; transaction, integration, and SEC conversion expenses; and other non-recurring items.
The following table provides a reconciliation of Net income (loss) attributable to SSR Mining shareholders to adjusted net income (loss) attributable to SSR Mining shareholders:
|
|
Three Months Ended |
|
Nine Months Ended |
||||||||||||
(in thousands of US dollars, except per share data) |
|
September 30, |
|
September 30, |
||||||||||||
|
|
2023 |
|
|
2022 |
|
|
2023 |
|
|
2022 |
|
||||
Net income attributable to SSR Mining shareholders (GAAP) |
|
$ |
15,159 |
|
|
$ |
(25,793 |
) |
|
$ |
119,838 |
|
|
$ |
100,256 |
|
Interest saving on convertible notes, net of tax |
|
$ |
— |
|
|
$ |
— |
|
|
$ |
3,693 |
|
|
$ |
3,677 |
|
Net income used in the calculation of diluted net income per share |
|
$ |
15,159 |
|
|
$ |
(25,793 |
) |
|
$ |
123,531 |
|
|
$ |
103,933 |
|
|
|
|
|
|
|
|
|
|
|
|
|
|
||||
Weighted-average shares used in the calculation of net income and adjusted net income per share |
||||||||||||||||
Basic |
|
|
203,878 |
|
|
|
207,983 |
|
|
|
205,101 |
|
|
|
210,986 |
|
Diluted |
|
|
203,878 |
|
|
|
207,983 |
|
|
|
217,902 |
|
|
|
223,543 |
|
|
|
|
|
|
|
|
|
|
|
|
|
|
||||
Net income per share attributable to SSR Mining shareholders (GAAP) |
|
|
|
|
|
|
|
|
|
|
|
|
||||
Basic |
|
$ |
0.07 |
|
|
$ |
(0.12 |
) |
|
$ |
0.58 |
|
|
$ |
0.48 |
|
Diluted |
|
$ |
0.07 |
|
|
$ |
(0.12 |
) |
|
$ |
0.57 |
|
|
$ |
0.46 |
|
|
|
|
|
|
|
|
|
|
|
|
|
|
||||
Adjustments: |
|
|
|
|
|
|
|
|
|
|
|
|
||||
Foreign exchange loss (gain) (18) |
|
$ |
— |
|
|
$ |
11,577 |
|
|
$ |
— |
|
|
$ |
19,733 |
|
Pitarrilla transaction costs |
|
$ |
— |
|
|
$ |
1,561 |
|
|
$ |
— |
|
|
$ |
1,561 |
|
Artmin transaction and integration costs |
|
$ |
30 |
|
|
$ |
— |
|
|
$ |
406 |
|
|
$ |
— |
|
SEC conversion costs |
|
$ |
— |
|
|
$ |
— |
|
|
$ |
— |
|
|
$ |
1,255 |
|
Impairment of other assets |
|
$ |
2,637 |
|
|
$ |
— |
|
|
$ |
2,637 |
|
|
$ |
— |
|
Change in fair value of marketable securities |
|
$ |
555 |
|
|
$ |
37 |
|
|
$ |
(565 |
) |
|
$ |
3,836 |
|
Loss (gain) on sale of mineral properties, plant and equipment |
|
$ |
560 |
|
|
$ |
(128 |
) |
|
$ |
1,610 |
|
|
$ |
1,213 |
|
Income tax impact related to above adjustments |
|
$ |
(815 |
) |
|
$ |
(382 |
) |
|
$ |
(785 |
) |
|
$ |
(2,045 |
) |
Foreign exchange (gain) loss and inflationary impacts on tax balances (18) |
$ |
(1,631 |
) |
|
$ |
(11,850 |
) |
|
$ |
(12,371 |
) |
|
$ |
(18,020 |
) |
|
Impact of income tax rate change in Türkiye |
|
$ |
37,170 |
|
|
$ |
— |
|
|
$ |
37,170 |
|
|
$ |
— |
|
Other tax adjustments (19) |
|
$ |
(625 |
) |
|
$ |
11,445 |
|
|
$ |
1,477 |
|
|
$ |
11,445 |
|
Adjusted net income attributable to SSR Mining shareholders (Non-GAAP) |
|
$ |
53,040 |
|
|
$ |
(13,533 |
) |
|
$ |
149,417 |
|
|
$ |
119,234 |
|
|
|
|
|
|
|
|
|
|
|
|
|
|
||||
Adjusted net income per share attributable to SSR Mining shareholders (Non-GAAP) |
||||||||||||||||
Basic |
|
$ |
0.26 |
|
|
$ |
(0.07 |
) |
|
$ |
0.73 |
|
|
$ |
0.57 |
|
Diluted |
|
$ |
0.26 |
|
|
$ |
(0.07 |
) |
|
$ |
0.70 |
|
|
$ |
0.55 |
|
(18) Effective January 1, 2023, the Company no longer adjusts for the effects of foreign exchange gains and losses.
(19) Represents charges related to a one-time tax imposed by Türkiye to fund earthquake recovery efforts, offset by a release of an uncertain tax position.
Non-GAAP Measure - Free Cash Flow
The Company uses free cash flow, cash flow from operating activities before changes in working capital, and free cash flow before changes in working capital to supplement information in its condensed consolidated financial statements. The most directly comparable financial measures prepared in accordance with GAAP is cash provided by operating activities. The Company believes that in addition to conventional measures prepared in accordance with US GAAP, certain investors and analysts use this information to evaluate the ability of the Company to generate cash flow after capital investments and build the Company's cash resources. The Company calculates free cash flow by deducting cash capital spending from cash generated by operating activities.
The following table provides a reconciliation of cash provided by operating activities to free cash flow:
|
|
Three Months Ended |
|
Nine Months Ended |
||||||||||||
(in thousands of US dollars, except per share data) |
|
September 30, |
|
September 30, |
||||||||||||
|
|
2023 |
|
|
2022 |
|
|
2023 |
|
|
2022 |
|
||||
Cash provided by operating activities (GAAP) |
|
$ |
135,256 |
|
|
$ |
(52,226 |
) |
|
$ |
218,566 |
|
|
$ |
42,799 |
|
Expenditures on mineral properties, plant, and equipment |
|
$ |
(47,456 |
) |
|
$ |
(39,825 |
) |
|
$ |
(164,633 |
) |
|
$ |
(91,317 |
) |
Free cash flow (non-GAAP) |
|
$ |
87,800 |
|
|
$ |
(92,051 |
) |
|
$ |
53,933 |
|
|
$ |
(48,518 |
) |
We also present operating cash flow before working capital adjustments and free cash flow before working capital adjustments as non-GAAP cash flow measures to supplement our operating cash flow and free cash flow (non-GAAP) measures. We believe presenting both operating cash flow and free cash flow before working capital adjustments, which reflects an exclusion of net changes in operating assets and liabilities, will be useful for investors because it presents cash flow that is actually generated from the continuing business. The Company calculates cash flow from operating activities before changes in working capital by adjusting cash provided by operating activities by the net change in operating assets and liabilities. The Company also calculates free cash flow before changes in working capital by deducting cash capital spending from cash flow from operating activities before changes in working capital.
The following table provides a reconciliation of cash provided by operating activities to free cash flow before changes in working capital:
|
|
Three Months Ended |
|
Nine Months Ended |
||||||||||||
(in thousands of US dollars, except per share data) |
|
September 30, |
|
September 30, |
||||||||||||
|
|
2023 |
|
|
2022 |
|
|
2023 |
|
|
2022 |
|
||||
Cash generated by (used in) operating activities (GAAP) |
|
$ |
135,256 |
|
|
$ |
(52,226 |
) |
|
$ |
218,566 |
|
|
$ |
42,799 |
|
Net change in operating assets and liabilities |
|
$ |
7,094 |
|
|
$ |
28,560 |
|
|
$ |
118,918 |
|
|
$ |
169,904 |
|
Cash generated by (used in) operating activities before changes in
|
|
$ |
142,350 |
|
|
$ |
(23,666 |
) |
|
$ |
337,484 |
|
|
$ |
212,703 |
|
Expenditures on mineral properties, plant, and equipment |
|
$ |
(47,456 |
) |
|
$ |
(39,825 |
) |
|
$ |
(164,633 |
) |
|
$ |
(91,317 |
) |
Free cash flow before changes in working capital (non-GAAP) |
|
$ |
94,894 |
|
|
$ |
(63,491 |
) |
|
$ |
172,851 |
|
|
$ |
121,386 |
|
View source version on businesswire.com: https://www.businesswire.com/news/home/20231030550829/en/
Contacts
SSR Mining:
F. Edward Farid, Executive Vice President, Chief Corporate Development Officer
Alex Hunchak, Director, Corporate Development and Investor Relations
SSR Mining Inc.
E-Mail: invest@ssrmining.com
Phone: +1 (888) 338-0046
To receive SSR Mining’s news releases by e-mail, please register using the SSR Mining website at www.ssrmining.com.


