

SOUTH JORDAN, Utah., Feb. 22, 2024 (GLOBE NEWSWIRE) -- Health Catalyst, Inc. ("Health Catalyst," Nasdaq: HCAT), a leading provider of data and analytics technology and services to healthcare organizations, today reported financial results for the quarter and year ended December 31, 2023.
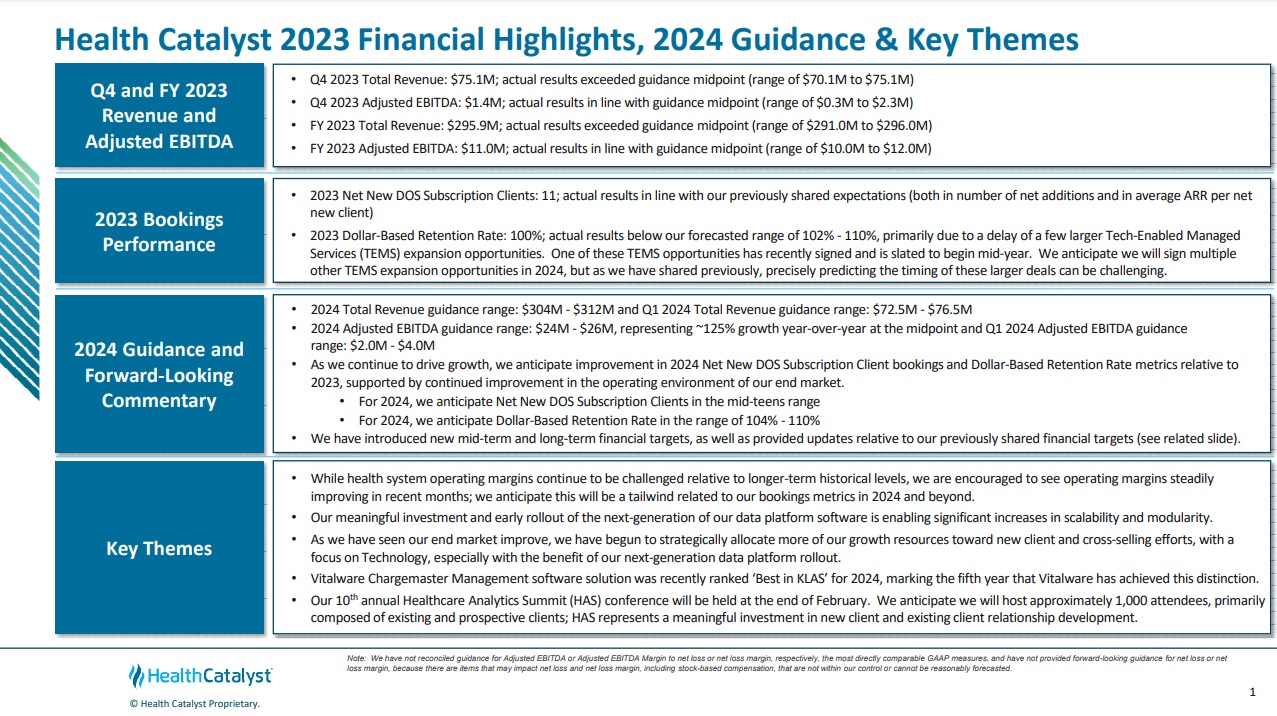
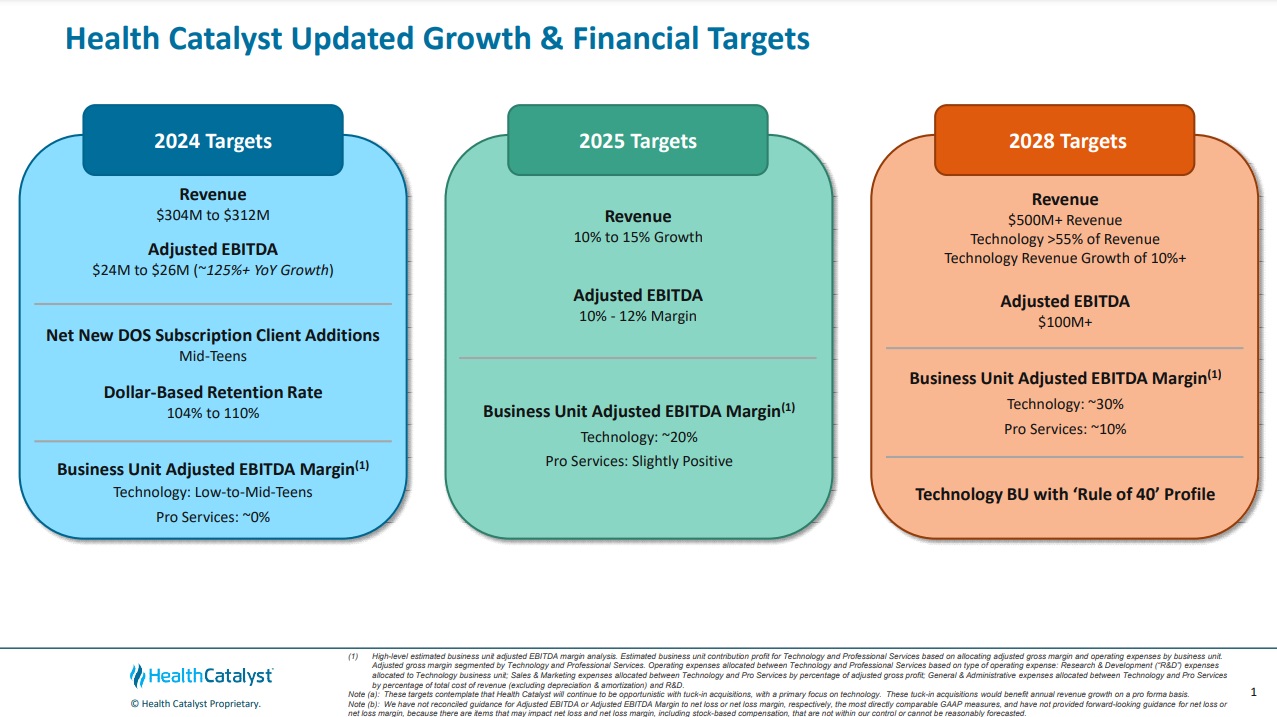
“For the full year 2023, I am pleased to share that we achieved strong performance across our business, including total revenue of $295.9 million, with this result beating the midpoint of our most recent guidance, and Adjusted EBITDA of $11.0 million, with this result in line with the midpoint of our most recent guidance. Additionally, I am pleased by our meaningful 2023 Adjusted EBITDA margin progress relative to 2022, and I am excited that we anticipate material year-over-year Adjusted EBITDA growth again in 2024, at a rate of approximately 125%+,” said Dan Burton, CEO of Health Catalyst.
“Additionally, in connection with our annual planning process, we are enacting multiple Leadership level changes. First, Bryan Hunt will be transitioning from CFO to a Strategic Advisor role, effective March 1, 2024. I would like to express my heartfelt gratitude to Bryan for his countless contributions to Health Catalyst’s growth and success over the last ten years, including his service as our CFO, helping us navigate through a global pandemic, record high inflation, and a period of tremendous financial pressure for our health system clients. Bryan has been an extraordinary leader and partner to me and to our Board of Directors, and we are grateful for his dedication, professionalism and commitment to the company and its mission. I am also pleased to share that Jason Alger will begin as Health Catalyst’s CFO, effective March 1, 2024. Jason has been with Health Catalyst for more than ten years, having contributed significantly during that time, including most recently as our Chief Accounting Officer. Prior to joining Health Catalyst, Jason held various roles at Ernst & Young. My fellow board members and I, along with our finance organization, have the utmost confidence in and respect for Jason. Also, effective March 1, 2024, Dan LeSueur will be promoted to Health Catalyst’s Chief Operating Officer role, with responsibilities spanning both our Technology and Professional Services business units. Dan brings a wealth of experience to this role, having had leadership responsibility across many functions during his twelve years at Health Catalyst, most recently as the Senior Vice President and General Manager of our Professional Services Business Unit. I am thrilled to have someone with Dan’s breadth and depth of expertise to lead this important strategic function as Health Catalyst continues on its maturation path, focusing on operational excellence to enable scalable growth and profitability.”
Financial Highlights for the Three and Twelve Months Ended December 31, 2023
Key Financial Measures
| Three Months Ended December 31, | Year over Year Change | Twelve Months Ended December 31, | Year over Year Change | ||||||||||||||||||||||
| 2023 | 2022 | 2023 | 2022 | ||||||||||||||||||||||
| GAAP Financial Measures: | (in thousands, except percentages) | (in thousands, except percentages) | |||||||||||||||||||||||
| Technology revenue | $ | 47,100 | $ | 44,664 | 5 | % | $ | 187,583 | $ | 176,288 | 6 | % | |||||||||||||
| Professional services revenue | $ | 27,984 | $ | 24,498 | 14 | % | $ | 108,355 | $ | 99,948 | 8 | % | |||||||||||||
| Total revenue | $ | 75,084 | $ | 69,162 | 9 | % | $ | 295,938 | $ | 276,236 | 7 | % | |||||||||||||
| Loss from operations | $ | (32,785 | ) | $ | (36,745 | ) | 11 | % | $ | (126,897 | ) | $ | (140,005 | ) | 9 | % | |||||||||
| Net loss | $ | (30,312 | ) | $ | (35,782 | ) | 15 | % | $ | (118,147 | ) | $ | (137,403 | ) | 14 | % | |||||||||
| Non-GAAP Financial Measures:(1) | |||||||||||||||||||||||||
| Adjusted Technology Gross Profit | $ | 31,388 | $ | 30,725 | 2 | % | $ | 127,744 | $ | 122,284 | 4 | % | |||||||||||||
| Adjusted Technology Gross Margin | 67 | % | 69 | % | 68 | % | 69 | % | |||||||||||||||||
| Adjusted Professional Services Gross Profit | $ | 3,305 | $ | 4,325 | (24 | )% | $ | 16,316 | $ | 23,565 | (31 | )% | |||||||||||||
| Adjusted Professional Services Gross Margin | 12 | % | 18 | % | 15 | % | 24 | % | |||||||||||||||||
| Total Adjusted Gross Profit | $ | 34,693 | $ | 35,050 | (1 | )% | $ | 144,060 | $ | 145,849 | (1 | )% | |||||||||||||
| Total Adjusted Gross Margin | 46 | % | 51 | % | 49 | % | 53 | % | |||||||||||||||||
| Adjusted EBITDA | $ | 1,352 | $ | (603 | ) | 324 | % | $ | 11,021 | $ | (2,487 | ) | 543 | % | |||||||||||
________________________
(1) These measures are not calculated in accordance with generally accepted accounting principles in the United States (GAAP). See the accompanying "Non-GAAP Financial Measures" section below for more information about these financial measures, including the limitations of such measures, and for a reconciliation of each measure to the most directly comparable measure calculated in accordance with GAAP.
Other Key Metrics
| As of December 31, | ||||||||
| 2023 | 2022 | 2021 | ||||||
| DOS Subscription Clients | 109 | 98 | 90 | |||||
| Year Ended December 31, | ||||||||
| 2023 | 2022 | 2021 | ||||||
| Dollar-based Retention Rate | 100 | % | 100 | % | 112 | % | ||
Financial Outlook
Health Catalyst provides forward-looking guidance on total revenue, a GAAP measure, and Adjusted EBITDA, a non-GAAP measure.
For the first quarter of 2024, we expect:
- Total revenue between $72.5 million and $76.5 million, and
- Adjusted EBITDA between $2.0 million and $4.0 million
For the full year of 2024, we expect:
- Total revenue between $304 million and $312 million, and
- Adjusted EBITDA between $24 million and $26 million
We have not reconciled guidance for Adjusted EBITDA to net loss, the most directly comparable GAAP measure, and have not provided forward-looking guidance for net loss, because there are items that may impact net loss, including stock-based compensation, that are not within our control or cannot be reasonably forecasted.
Quarterly Conference Call Details
The company will host a conference call to review the results today, Thursday, February 22, 2024 at 5:00 p.m. E.T. The conference call can be accessed by dialing (800) 267-6316 for U.S. participants, or (203) 518-9783 for international participants, and referencing conference ID “HCAT Q423.” A live audio webcast will be available online at https://ir.healthcatalyst.com/. A replay of the call will be available via webcast for on-demand listening shortly after the completion of the call, at the same web link, and will remain available for approximately 90 days.
About Health Catalyst
Health Catalyst is a leading provider of data and analytics technology and services to healthcare organizations committed to being the catalyst for massive, measurable, data-informed healthcare improvement. Its clients leverage the cloud-based data platform — powered by data from more than 100 million patient records and encompassing trillions of facts — as well as its analytics software and professional services expertise to make data-informed decisions and realize measurable clinical, financial, and operational improvements. Health Catalyst envisions a future in which all healthcare decisions are data informed.
Available Information
Our investors and others should note that we announce material information to the public about our company, products and services, and other matters related to our company through a variety of means, including our website (https://www.healthcatalyst.com/), our investor relations website (https://ir.healthcatalyst.com/), press releases, SEC filings, public conference calls, and social media, including our and our CEO's social media accounts, in order to achieve broad, non-exclusionary distribution of information to the public and to comply with our disclosure obligations under Regulation FD.
Forward-Looking Statements
This release contains forward-looking statements within the meaning of Section 27A of the Securities Act of 1933, as amended, and Section 21E of the Securities Exchange Act of 1934, as amended, and the Private Securities Litigation Reform Act of 1995, as amended. These forward-looking statements include statements regarding our future growth and our financial outlook for Q1 and fiscal year 2024. Forward-looking statements are subject to risks and uncertainties and are based on potentially inaccurate assumptions that could cause actual results to differ materially from those expected or implied by the forward-looking statements. Actual results may differ materially from the results predicted, and reported results should not be considered as an indication of future performance.
Important risks and uncertainties that could cause our actual results and financial condition to differ materially from those indicated in the forward-looking statements include, among others, the following: (i) changes in laws and regulations applicable to our business model; (ii) changes in market or industry conditions, regulatory environment, and receptivity to our technology and services; (iii) results of litigation or a security incident; (iv) the loss of one or more key clients or partners; (v) macroeconomic challenges (including high inflationary and/or high interest rate environments, or market volatility caused by bank failures and measures taken in response thereto) and any new public health crisis; and (vi) changes to our abilities to recruit and retain qualified team members. For a detailed discussion of the risk factors that could affect our actual results, please refer to the risk factors identified in our SEC reports, including, but not limited to the Quarterly Report on Form 10-Q for the fiscal quarter ended September 30, 2023 that was filed with the SEC on November 6, 2023 and the Annual Report on Form 10-K for the year ended December 31, 2023 expected to be filed with the SEC on or about February 22, 2024. All information provided in this release and in the attachments is as of the date hereof, and we undertake no duty to update or revise this information unless required by law.
Condensed Consolidated Balance Sheets
(in thousands, except share and per share data, unaudited)
| As of December 31, | |||||||
| 2023 | 2022 | ||||||
| Assets | |||||||
| Current assets: | |||||||
| Cash and cash equivalents | $ | 106,276 | $ | 116,312 | |||
| Short-term investments | 211,452 | 247,178 | |||||
| Accounts receivable, net | 60,290 | 47,970 | |||||
| Prepaid expenses and other assets | 15,379 | 16,335 | |||||
| Total current assets | 393,397 | 427,795 | |||||
| Property and equipment, net | 25,712 | 25,928 | |||||
| Operating lease right-of-use assets | 13,927 | 16,658 | |||||
| Intangible assets, net | 73,384 | 92,189 | |||||
| Goodwill | 190,652 | 185,982 | |||||
| Other assets | 4,742 | 3,734 | |||||
| Total assets | $ | 701,814 | $ | 752,286 | |||
| Liabilities and stockholders’ equity | |||||||
| Current liabilities: | |||||||
| Accounts payable | $ | 6,641 | $ | 4,424 | |||
| Accrued liabilities | 23,282 | 19,691 | |||||
| Deferred revenue | 55,753 | 54,961 | |||||
| Operating lease liabilities | 3,358 | 3,434 | |||||
| Total current liabilities | 89,034 | 82,510 | |||||
| Convertible senior notes | 228,034 | 226,523 | |||||
| Deferred revenue, net of current portion | 77 | 105 | |||||
| Operating lease liabilities, net of current portion | 17,676 | 18,017 | |||||
| Other liabilities | 74 | 121 | |||||
| Total liabilities | 334,895 | 327,276 | |||||
| Commitments and contingencies | |||||||
| Stockholders’ equity: | |||||||
| Preferred stock, $0.001 par value per share and additional paid-in capital; 25,000,000 shares authorized and no shares issued and outstanding as of December 31, 2023 and 2022 | — | — | |||||
| Common stock, $0.001 par value per share, and additional paid-in capital; 500,000,000 shares authorized as of December 31, 2023 and 2022; 58,295,491 and 55,261,922 shares issued and outstanding as of December 31, 2023 and 2022, respectively | 1,484,056 | 1,424,681 | |||||
| Accumulated deficit | (1,117,170 | ) | (999,023 | ) | |||
| Accumulated other comprehensive income (loss) | 33 | (648 | ) | ||||
| Total stockholders’ equity | 366,919 | 425,010 | |||||
| Total liabilities and stockholders’ equity | $ | 701,814 | $ | 752,286 | |||
Condensed Consolidated Statements of Operations
(in thousands, except per share data, unaudited)
| Three Months Ended December 31, | Twelve Months Ended December 31, | ||||||||||||||
| 2023 | 2022 | 2023 | 2022 | ||||||||||||
| Revenue: | |||||||||||||||
| Technology | $ | 47,100 | $ | 44,664 | $ | 187,583 | $ | 176,288 | |||||||
| Professional services | 27,984 | 24,498 | 108,355 | 99,948 | |||||||||||
| Total revenue | 75,084 | 69,162 | 295,938 | 276,236 | |||||||||||
| Cost of revenue, excluding depreciation and amortization: | |||||||||||||||
| Technology(1)(2)(3) | 16,719 | 14,747 | 62,474 | 56,642 | |||||||||||
| Professional services(1)(2)(3) | 27,857 | 23,359 | 101,631 | 86,407 | |||||||||||
| Total cost of revenue, excluding depreciation and amortization | 44,576 | 38,106 | 164,105 | 143,049 | |||||||||||
| Operating expenses: | |||||||||||||||
| Sales and marketing(1)(2)(3) | 17,271 | 20,373 | 67,321 | 87,514 | |||||||||||
| Research and development(1)(2)(3) | 20,288 | 19,614 | 72,627 | 75,680 | |||||||||||
| General and administrative(1)(2)(3)(4)(5) | 15,430 | 16,150 | 76,559 | 61,701 | |||||||||||
| Depreciation and amortization | 10,304 | 11,664 | 42,223 | 48,297 | |||||||||||
| Total operating expenses | 63,293 | 67,801 | 258,730 | 273,192 | |||||||||||
| Loss from operations | (32,785 | ) | (36,745 | ) | (126,897 | ) | (140,005 | ) | |||||||
| Loss on extinguishment of debt | — | — | — | — | |||||||||||
| Interest and other expense, net | 2,616 | 1,022 | 9,106 | (1,678 | ) | ||||||||||
| Loss before income taxes | (30,169 | ) | (35,723 | ) | (117,791 | ) | (141,683 | ) | |||||||
| Income tax provision (benefit)(2) | 143 | 59 | 356 | (4,280 | ) | ||||||||||
| Net loss | $ | (30,312 | ) | $ | (35,782 | ) | $ | (118,147 | ) | $ | (137,403 | ) | |||
| Net loss per share, basic | $ | (0.53 | ) | $ | (0.66 | ) | $ | (2.09 | ) | $ | (2.56 | ) | |||
| Net loss per share, diluted | $ | (0.53 | ) | $ | (0.66 | ) | $ | (2.09 | ) | $ | (2.63 | ) | |||
| Weighted-average shares outstanding used in calculating net loss per share, basic | 57,476 | 54,496 | 56,418 | 53,722 | |||||||||||
| Weighted-average shares outstanding used in calculating net loss per share, diluted | 57,476 | 54,496 | 56,418 | 54,080 | |||||||||||
_______________
(1) Includes stock-based compensation expense as follows:
| Three Months Ended December 31, | Twelve Months Ended December 31, | ||||||||||
| 2023 | 2022 | 2023 | 2022 | ||||||||
| Stock-Based Compensation Expense: | (in thousands) | (in thousands) | |||||||||
| Cost of revenue, excluding depreciation and amortization: | |||||||||||
| Technology | $ | 458 | $ | 495 | $ | 1,866 | $ | 2,058 | |||
| Professional services | 1,687 | 2,148 | 7,369 | 8,230 | |||||||
| Sales and marketing | 4,933 | 7,157 | 20,982 | 28,082 | |||||||
| Research and development | 2,536 | 3,295 | 11,213 | 12,938 | |||||||
| General and administrative | 3,397 | 5,653 | 14,326 | 20,796 | |||||||
| Total | $ | 13,011 | $ | 18,748 | $ | 55,756 | $ | 72,104 | |||
(2) Includes acquisition-related costs, net as follows:
| Three Months Ended December 31, | Twelve Months Ended December 31, | |||||||||||
| 2023 | 2022 | 2023 | 2022 | |||||||||
| Acquisition-related costs, net: | (in thousands) | (in thousands) | ||||||||||
| Cost of revenue, excluding depreciation and amortization: | ||||||||||||
| Technology | $ | 65 | $ | 84 | $ | 273 | $ | 351 | ||||
| Professional services | 93 | 146 | 391 | 655 | ||||||||
| Sales and marketing | 393 | 337 | 697 | 1,894 | ||||||||
| Research and development | 200 | 687 | 787 | 3,045 | ||||||||
| General and administrative | 1,904 | 452 | 3,609 | (1,051 | ) | |||||||
| Income tax benefit | — | — | — | (4,533 | ) | |||||||
| Total | $ | 2,655 | $ | 1,706 | $ | 5,757 | $ | 361 | ||||
(3) Includes restructuring costs, as follows:
| Three Months Ended December 31, | Twelve Months Ended December 31, | ||||||||||
| 2023 | 2022 | 2023 | 2022 | ||||||||
| Restructuring costs: | (in thousands) | (in thousands) | |||||||||
| Cost of revenue, excluding depreciation and amortization: | |||||||||||
| Technology | $ | 484 | $ | 229 | $ | 496 | $ | 229 | |||
| Professional services | 1,398 | 892 | 1,832 | 1,139 | |||||||
| Sales and marketing | 1,210 | 1,464 | 2,415 | 3,023 | |||||||
| Research and development | 3,051 | 1,153 | 3,337 | 3,410 | |||||||
| General and administrative | 624 | 188 | 742 | 624 | |||||||
| Total | $ | 6,767 | $ | 3,926 | $ | 8,822 | $ | 8,425 | |||
(4) Includes litigation costs, as follows:
| Three Months Ended December 31, | Twelve Months Ended December 31, | ||||||||||
| 2023 | 2022 | 2023 | 2022 | ||||||||
| Litigation costs: | (in thousands) | (in thousands) | |||||||||
| General and administrative | $ | — | $ | — | $ | 21,279 | $ | — | |||
(5) Includes non-recurring lease-related charges, as follows:
| Three Months Ended December 31, | Twelve Months Ended December 31, | ||||||||||
| 2023 | 2022 | 2023 | 2022 | ||||||||
| Non-recurring lease-related charges: | (in thousands) | (in thousands) | |||||||||
| General and administrative | $ | 1,400 | $ | 98 | $ | 4,081 | $ | 3,798 | |||
Condensed Consolidated Statements of Cash Flows
(in thousands, unaudited)
| Year Ended December 31, | |||||||
| 2023 | 2022 | ||||||
| Cash flows from operating activities | |||||||
| Net loss | $ | (118,147 | ) | $ | (137,403 | ) | |
| Adjustments to reconcile net loss to net cash used in operating activities: | |||||||
| Stock-based compensation expense | 55,756 | 72,104 | |||||
| Depreciation and amortization | 42,223 | 48,297 | |||||
| Investment (discount accretion) and premium amortization | (9,720 | ) | (2,236 | ) | |||
| Impairment of long-lived assets | 4,081 | 5,023 | |||||
| Non-cash operating lease expense | 2,990 | 3,231 | |||||
| Provision for expected credit losses | 1,821 | 691 | |||||
| Amortization of debt discount and issuance costs | 1,511 | 1,500 | |||||
| Deferred tax provision (benefit) | 8 | (4,523 | ) | ||||
| Change in fair value of contingent consideration liabilities | — | (4,668 | ) | ||||
| Payment of acquisition-related contingent consideration | — | (3,234 | ) | ||||
| Other | 67 | (145 | ) | ||||
| Change in operating assets and liabilities: | |||||||
| Accounts receivable | (13,663 | ) | 788 | ||||
| Prepaid expenses and other assets | 164 | (478 | ) | ||||
| Accounts payable, accrued liabilities, and other liabilities | 4,868 | (4,702 | ) | ||||
| Deferred revenue | (1,487 | ) | (5,997 | ) | |||
| Operating lease liabilities | (3,552 | ) | (3,518 | ) | |||
| Net cash used in operating activities | (33,080 | ) | (35,270 | ) | |||
| Cash flows from investing activities | |||||||
| Proceeds from the sale and maturity of short-term investments | 336,801 | 315,171 | |||||
| Purchase of short-term investments | (290,836 | ) | (308,961 | ) | |||
| Capitalization of internal use software | (11,957 | ) | (12,987 | ) | |||
| Acquisition of businesses, net of cash acquired | (11,392 | ) | (27,846 | ) | |||
| Purchases of property and equipment | (1,236 | ) | (2,167 | ) | |||
| Purchase of intangible assets | (1,118 | ) | (2,260 | ) | |||
| Proceeds from the sale of property and equipment | 31 | 29 | |||||
| Net cash provided by (used in) investing activities | 20,293 | (39,021 | ) | ||||
| Cash flows from financing activities | |||||||
| Proceeds from employee stock purchase plan | 3,588 | 3,153 | |||||
| Repurchase of common stock | (1,808 | ) | (8,393 | ) | |||
| Proceeds from exercise of stock options | 950 | 3,969 | |||||
| Payments of acquisition-related consideration | — | (1,342 | ) | ||||
| Net cash provided by (used in) financing activities | 2,730 | (2,613 | ) | ||||
| Effect of exchange rate changes on cash and cash equivalents | 21 | (11 | ) | ||||
| Net decrease in cash and cash equivalents | (10,036 | ) | (76,915 | ) | |||
| Cash and cash equivalents at beginning of period | 116,312 | 193,227 | |||||
| Cash and cash equivalents at end of period | $ | 106,276 | $ | 116,312 | |||
Non-GAAP Financial Measures
To supplement our financial information presented in accordance with GAAP, we believe certain non-GAAP financial measures, including Adjusted Gross Profit, Adjusted Gross Margin, Adjusted EBITDA, Adjusted Net Income (Loss), and Adjusted Net Income (Loss) per share, basic and diluted, are useful in evaluating our operating performance. For example, we exclude stock-based compensation expense because it is non-cash in nature and excluding this expense provides meaningful supplemental information regarding our operational performance and allows investors the ability to make more meaningful comparisons between our operating results and those of other companies. We use this non-GAAP financial information to evaluate our ongoing operations, as a component in determining employee bonus compensation, and for internal planning and forecasting purposes.
We believe that non-GAAP financial information, when taken collectively, may be helpful to investors because it provides consistency and comparability with past financial performance. However, non-GAAP financial information is presented for supplemental informational purposes only, has limitations as an analytical tool and should not be considered in isolation or as a substitute for financial information presented in accordance with GAAP. In addition, other companies, including companies in our industry, may calculate similarly-titled non-GAAP financial measures differently or may use other measures to evaluate their performance. A reconciliation is provided below for each non-GAAP financial measure to the most directly comparable financial measure stated in accordance with GAAP. Investors are encouraged to review the related GAAP financial measures and the reconciliation of these non-GAAP financial measures to their most directly comparable GAAP financial measures, and not to rely on any single financial measure to evaluate our business.
Adjusted Gross Profit and Adjusted Gross Margin
Adjusted Gross Profit is a non-GAAP financial measure that we define as revenue less cost of revenue, excluding depreciation and amortization, adding back stock-based compensation, acquisition-related costs, net, and restructuring costs as applicable. We define Adjusted Gross Margin as our Adjusted Gross Profit divided by our revenue. We believe Adjusted Gross Profit and Adjusted Gross Margin are useful to investors as they eliminate the impact of certain non-cash expenses and certain other non-recurring operating expenses, and allow a direct comparison of these measures between periods without the impact of non-cash expenses and certain other non-recurring operating expenses. The following is a reconciliation of revenue, the most directly comparable GAAP financial measure, to Adjusted Gross Profit, for the three and twelve months ended December 31, 2023 and 2022:
| Three Months Ended December 31, 2023 | |||||||||||
| (in thousands, except percentages) | |||||||||||
| Technology | Professional Services | Total | |||||||||
| Revenue | $ | 47,100 | $ | 27,984 | $ | 75,084 | |||||
| Cost of revenue, excluding depreciation and amortization | (16,719 | ) | (27,857 | ) | (44,576 | ) | |||||
| Gross profit, excluding depreciation and amortization | 30,381 | 127 | 30,508 | ||||||||
| Add: | |||||||||||
| Stock-based compensation | 458 | 1,687 | 2,145 | ||||||||
| Acquisition-related costs, net(1) | 65 | 93 | 158 | ||||||||
| Restructuring costs(2) | 484 | 1,398 | 1,882 | ||||||||
| Adjusted Gross Profit | $ | 31,388 | $ | 3,305 | $ | 34,693 | |||||
| Gross margin, excluding depreciation and amortization | 65 | % | — | % | 41 | % | |||||
| Adjusted Gross Margin | 67 | % | 12 | % | 46 | % | |||||
___________________
(1) Acquisition-related costs, net include deferred retention expenses following the ARMUS and KPI Ninja acquisitions.
(2) Restructuring costs include severance and other team member costs from workforce reductions.
| Three Months Ended December 31, 2022 | |||||||||||
| (in thousands, except percentages) | |||||||||||
| Technology | Professional Services | Total | |||||||||
| Revenue | $ | 44,664 | $ | 24,498 | $ | 69,162 | |||||
| Cost of revenue, excluding depreciation and amortization | (14,747 | ) | (23,359 | ) | (38,106 | ) | |||||
| Gross profit, excluding depreciation and amortization | 29,917 | 1,139 | 31,056 | ||||||||
| Add: | |||||||||||
| Stock-based compensation | 495 | 2,148 | 2,643 | ||||||||
| Acquisition-related costs, net(1) | 84 | 146 | 230 | ||||||||
| Restructuring costs(2) | 229 | 892 | 1,121 | ||||||||
| Adjusted Gross Profit | $ | 30,725 | $ | 4,325 | $ | 35,050 | |||||
| Gross margin, excluding depreciation and amortization | 67 | % | 5 | % | 45 | % | |||||
| Adjusted Gross Margin | 69 | % | 18 | % | 51 | % | |||||
___________________
(1) Acquisition-related costs, net include deferred retention expenses following the ARMUS, KPI Ninja, and Twistle acquisitions.
(2) Restructuring costs include severance and other team member costs from workforce reductions.
| Twelve Months Ended December 31, 2023 | |||||||||||
| (in thousands, except percentages) | |||||||||||
| Technology | Professional Services | Total | |||||||||
| Revenue | $ | 187,583 | $ | 108,355 | $ | 295,938 | |||||
| Cost of revenue, excluding depreciation and amortization | (62,474 | ) | (101,631 | ) | (164,105 | ) | |||||
| Gross profit, excluding depreciation and amortization | 125,109 | 6,724 | 131,833 | ||||||||
| Add: | |||||||||||
| Stock-based compensation | 1,866 | 7,369 | 9,235 | ||||||||
| Acquisition-related costs, net(1) | 273 | 391 | 664 | ||||||||
| Restructuring costs(2) | 496 | 1,832 | 2,328 | ||||||||
| Adjusted Gross Profit | $ | 127,744 | $ | 16,316 | $ | 144,060 | |||||
| Gross margin, excluding depreciation and amortization | 67 | % | 6 | % | 45 | % | |||||
| Adjusted Gross Margin | 68 | % | 15 | % | 49 | % | |||||
___________________
(1) Acquisition-related costs, net include deferred retention expenses following the ARMUS, KPI Ninja, and Twistle acquisitions.
(2) Restructuring costs include severance and other team member costs from workforce reductions.
| Twelve Months Ended December 31, 2022 | |||||||||||
| (in thousands, except percentages) | |||||||||||
| Technology | Professional Services | Total | |||||||||
| Revenue | $ | 176,288 | $ | 99,948 | $ | 276,236 | |||||
| Cost of revenue, excluding depreciation and amortization | (56,642 | ) | (86,407 | ) | (143,049 | ) | |||||
| Gross profit, excluding depreciation and amortization | 119,646 | 13,541 | 133,187 | ||||||||
| Add: | |||||||||||
| Stock-based compensation | 2,058 | 8,230 | 10,288 | ||||||||
| Acquisition-related costs, net(1) | 351 | 655 | 1,006 | ||||||||
| Restructuring costs(2) | 229 | 1,139 | 1,368 | ||||||||
| Adjusted Gross Profit | $ | 122,284 | $ | 23,565 | $ | 145,849 | |||||
| Gross margin, excluding depreciation and amortization | 68 | % | 14 | % | 48 | % | |||||
| Adjusted Gross Margin | 69 | % | 24 | % | 53 | % | |||||
__________________
(1) Acquisition-related costs, net include deferred retention expenses following the ARMUS, KPI Ninja, and Twistle acquisitions.
(2) Restructuring costs include severance and other team member costs from workforce reductions.
Adjusted EBITDA
Adjusted EBITDA is a non-GAAP financial measure that we define as net loss adjusted for (i) interest and other (income) expense, net, (ii) income tax provision (benefit), (iii) depreciation and amortization, (iv) stock-based compensation, (v) acquisition-related costs, net, including the fair change in value of contingent consideration liabilities for potential earn-out payments, (vi) litigation costs, (vii) restructuring costs, and (viii) non-recurring lease-related charges. We view acquisition-related expenses when applicable, such as transaction costs and changes in the fair value of contingent consideration liabilities that are directly related to business combinations, as costs that are unpredictable, dependent upon factors outside of our control, and are not necessarily reflective of operational performance during a period. We believe that excluding restructuring costs, litigation costs, and non-recurring lease-related charges allows for more meaningful comparisons between operating results from period to period as this is separate from the core activities that arise in the ordinary course of our business and are not part of our ongoing operations. We believe Adjusted EBITDA provides investors with useful information on period-to-period performance as evaluated by management and a comparison with our past financial performance and is useful in evaluating our operating performance compared to that of other companies in our industry, as this metric generally eliminates the effects of certain items that may vary from company to company for reasons unrelated to overall operating performance. The following is a reconciliation of our net loss, the most directly comparable GAAP financial measure, to Adjusted EBITDA, for the three and twelve months ended December 31, 2023 and 2022:
| Three Months Ended December 31, | Twelve Months Ended December 31, | ||||||||||||||
| 2023 | 2022 | 2023 | 2022 | ||||||||||||
| (in thousands) | (in thousands) | ||||||||||||||
| Net loss | $ | (30,312 | ) | $ | (35,782 | ) | $ | (118,147 | ) | $ | (137,403 | ) | |||
| Add: | |||||||||||||||
| Interest and other (income) expense, net | (2,616 | ) | (1,022 | ) | (9,106 | ) | 1,678 | ||||||||
| Income tax provision (benefit) | 143 | 59 | 356 | (4,280 | ) | ||||||||||
| Depreciation and amortization | 10,304 | 11,664 | 42,223 | 48,297 | |||||||||||
| Stock-based compensation | 13,011 | 18,748 | 55,756 | 72,104 | |||||||||||
| Acquisition-related costs, net(1) | 2,655 | 1,706 | 5,757 | 4,894 | |||||||||||
| Litigation costs(2) | — | — | 21,279 | — | |||||||||||
| Restructuring costs(3) | 6,767 | 3,926 | 8,822 | 8,425 | |||||||||||
| Non-recurring lease-related charges(4) | 1,400 | 98 | 4,081 | 3,798 | |||||||||||
| Adjusted EBITDA | $ | 1,352 | $ | (603 | ) | $ | 11,021 | $ | (2,487 | ) | |||||
__________________
(1) Acquisition-related costs, net includes third-party fees associated with due diligence, deferred retention expenses, post-acquisition restructuring costs incurred as part of business combinations, and changes in fair value of contingent consideration liabilities for potential earn-out payments. For additional details refer to Notes 1, 2, and 7 in our consolidated financial statements.
(2) Litigation costs include costs related to litigation that are outside the ordinary course of our business. For additional details, refer to Note 16 in our consolidated financial statements.
(3) Restructuring costs include severance and other team member costs from workforce reductions, impairment of discontinued capitalized software projects, and other miscellaneous charges. For additional details, refer to Note 11 in our consolidated financial statements.
(4) Non-recurring lease-related charges includes lease-related impairment charges for the subleased portion of our corporate headquarters. For additional details refer to Note 9 in our consolidated financial statements.
Adjusted Net Income (Loss) and Adjusted Net Income (Loss) Per Share
Adjusted Net Income (Loss) is a non-GAAP financial measure that we define as net loss adjusted for (i) stock-based compensation, (ii) amortization of acquired intangibles, (iii) acquisition-related costs, net, including the deferred tax valuation allowance release from acquisitions, (iv) litigation costs, (v) restructuring costs, (vi) non-recurring lease-related charges, and (vii) non-cash interest expense related to our convertible senior notes. We believe Adjusted Net Income (Loss) provides investors with useful information on period-to-period performance as evaluated by management and comparison with our past financial performance and is useful in evaluating our operating performance compared to that of other companies in our industry, as this metric generally eliminates the effects of certain items that may vary from company to company for reasons unrelated to overall operating performance. The following is a reconciliation of our net loss, the most directly comparable GAAP financial measure, to Adjusted Net Income (Loss), for the three and twelve months ended December 31, 2023 and 2022:
| Three Months Ended December 31, | Twelve Months Ended December 31, | ||||||||||||||
| 2023 | 2022 | 2023 | 2022 | ||||||||||||
| Numerator: | (in thousands, except share and per share amounts) | ||||||||||||||
| Net loss | $ | (30,312 | ) | $ | (35,782 | ) | $ | (118,147 | ) | $ | (137,403 | ) | |||
| Add: | |||||||||||||||
| Stock-based compensation | 13,011 | 18,748 | 55,756 | 72,104 | |||||||||||
| Amortization of acquired intangibles | 7,243 | 8,464 | 29,636 | 37,188 | |||||||||||
| Acquisition-related costs, net(1) | 2,655 | 1,706 | 5,757 | 361 | |||||||||||
| Litigation costs(2) | — | — | 21,279 | — | |||||||||||
| Restructuring costs(3) | 6,767 | 3,926 | 8,822 | 8,425 | |||||||||||
| Non-recurring lease-related charges(4) | 1,400 | 98 | 4,081 | 3,798 | |||||||||||
| Non-cash interest expense related to convertible senior notes | 379 | 376 | 1,511 | 1,500 | |||||||||||
| Adjusted Net Income (Loss) | $ | 1,143 | $ | (2,464 | ) | $ | 8,695 | $ | (14,027 | ) | |||||
| Denominator: | |||||||||||||||
| Weighted-average number of shares used in calculating net loss per share, basic | 57,476,187 | 54,496,128 | 56,418,397 | 53,721,702 | |||||||||||
| Non-GAAP weighted-average effect of dilutive securities | 283,805 | — | 666,488 | — | |||||||||||
| Non-GAAP weighted-average number of shares used in calculating Adjusted Net Income (Loss) per share, diluted | 57,759,992 | 54,496,128 | 57,084,885 | 53,721,702 | |||||||||||
| Adjusted Net Income (Loss) per share, basic | $ | 0.02 | $ | (0.05 | ) | $ | 0.15 | $ | (0.26 | ) | |||||
| Adjusted Net Income (Loss) per share, diluted | $ | 0.02 | $ | (0.05 | ) | $ | 0.15 | $ | (0.26 | ) | |||||
______________
(1) Acquisition-related costs, net includes third-party fees associated with due diligence, deferred retention expenses, post-acquisition restructuring costs incurred as part of business combinations, changes in fair value of contingent consideration liabilities for potential earn-out payments, and the deferred tax valuation allowance release from acquisitions. For additional details refer to Notes 1, 2, 7, and 15 in our consolidated financial statements.
(2) Litigation costs include costs related to litigation that are outside the ordinary course of our business. For additional details, refer to Note 16 in our consolidated financial statements.
(3) Restructuring costs include severance and other team member costs from workforce reductions, impairment of discontinued capitalized software projects, and other miscellaneous charges. For additional details, refer to Note 11 in our consolidated financial statements.
(4) Includes the lease-related impairment charge for the subleased portion of our corporate headquarters. For additional details refer to Note 9 in our consolidated financial statements.
Health Catalyst Investor Relations Contact:
Adam Brown
Senior Vice President, Investor Relations and FP&A
+1 (855) 309-6800
ir@healthcatalyst.com
Health Catalyst Media Contact:
Tarah Neujahr Bryan
Chief Marketing Officer
media@healthcatalyst.com
To view this slide as a PDF, please click here: http://ml.globenewswire.com/Resource/Download/540180be-a9a0-4e69-b6ac-e247b84e663a
To view this slide as a PDF, please click here: http://ml.globenewswire.com/Resource/Download/c3e0a805-d056-4e53-a25e-e983f7edcd6f

![]()


