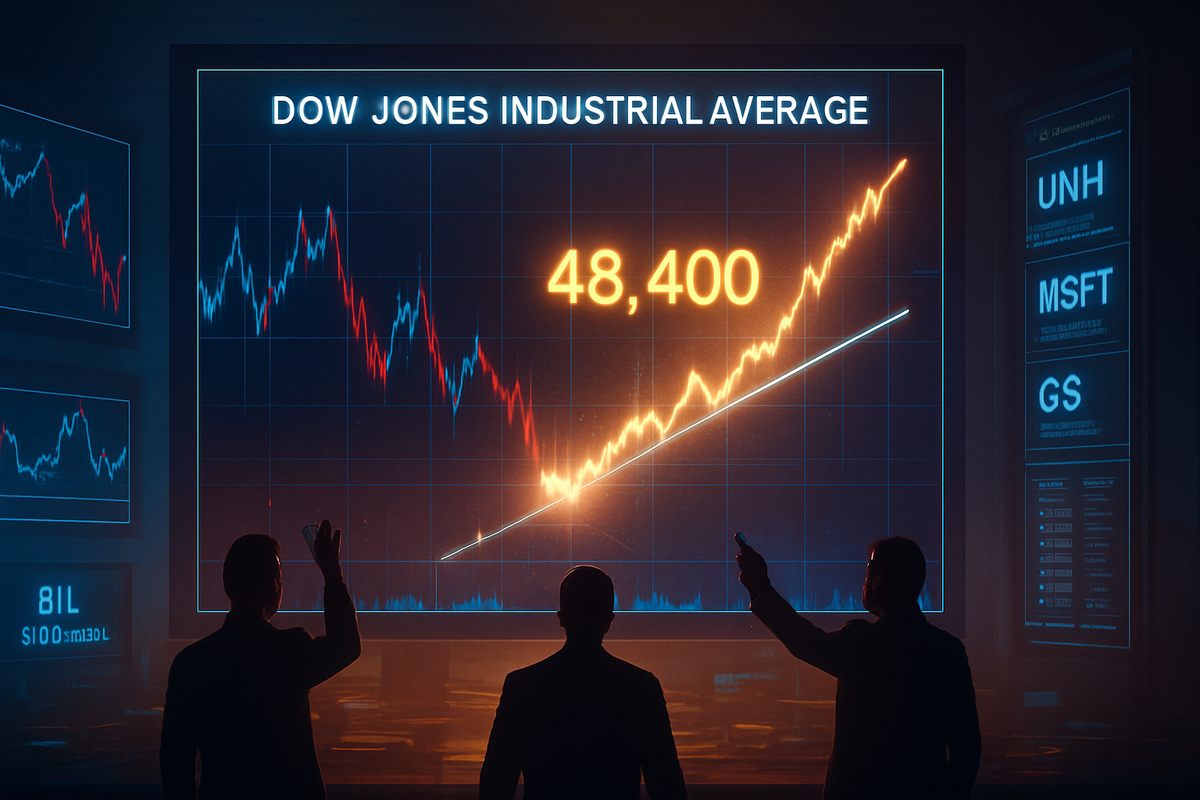
As of March 16, 2026, the Dow Jones Industrial Average is locked in a high-stakes tug-of-war between mounting geopolitical pressures and a desperate technical recovery. After a blistering 2025 that saw the index touch historic heights, the first quarter of 2026 has been defined by a "triple macro shock"—an energy crisis, reignited inflation, and a conflict in the Middle East that has sent Brent crude toward the $100 mark. Currently hovering in the 46,500 to 46,900 range, the index is facing its most significant technical test in years: the 48,400 resistance level.
Market analysts and technical chartists have identified the 48,400 mark as the "line in the sand" for the medium-term trajectory of the blue-chip index. Breaking above this level would not merely be a numerical victory; it would signal that the market has successfully absorbed the shock of the Strait of Hormuz closure and is ready to challenge the all-time highs of 50,512 reached just last month. Conversely, failure to breach this resistance could confirm a bearish "lower high" pattern, potentially inviting a deeper correction toward the 200-day moving average near 46,200.
The Road to 48,400: From AI Euphoria to Energy Shock
The journey to this critical juncture began with the exuberant bull market of 2025. Driven by massive capital expenditure in artificial intelligence and a series of Federal Reserve rate cuts that brought the Fed funds rate down to the 3.50%–3.75% range, the Dow finished 2025 with a robust 13% gain. This momentum carried into early February 2026, when the index breached the psychological 50,000 milestone for the first time in history, peaking at 50,512. Investors at the time were betting on a "soft landing" and a continuation of the tech-led productivity boom.
However, the narrative shifted violently in late February as geopolitical tensions escalated into a full-scale conflict involving Iran. The subsequent closure of the Strait of Hormuz—a vital artery for global oil shipments—triggered a "Strait of Hormuz Crash" that wiped out over 3,500 points in a matter of weeks. By early March 2026, the Dow had lost approximately 2,440 points, breaking below the 47,000 support level on March 12. The current "relief rally" observed today, March 16, is the market's first serious attempt to stabilize, placing the 48,400 resistance level directly in the crosshairs of technical traders.
The key players in this drama are not just the geopolitical actors, but the heavyweight components of the price-weighted index. Goldman Sachs Group Inc. (NYSE: GS) recently saw a 4.4% single-day drop that shaved 240 points off the index, while tech giants like Salesforce Inc. (NYSE: CRM) have struggled to maintain their 2025 valuations amidst rising "capex exhaustion" concerns. The market’s reaction today is one of cautious optimism, but the shadow of tomorrow’s Federal Open Market Committee (FOMC) meeting looms large.
Winners and Losers: A Divided Index
In this environment of high resistance and macro uncertainty, the Dow's internal dynamics are starkly divided. The primary "anchor" dragging the index away from the 48,400 mark is UnitedHealth Group Inc. (NYSE: UNH). As the highest-priced stock in the index, its roughly 50% decline from 2024 peaks—driven by a "Great Reset" in Medicare Advantage reimbursements—has been a persistent headwind. Trading around $282, UNH has become a symbol of the regulatory and structural pressures facing the healthcare sector in 2026.
On the other side of the ledger, energy and defensive stocks are providing the necessary ballast to even attempt a run at resistance. Chevron Corp. (NYSE: CVX) and Honeywell International Inc. (NASDAQ: HON) have benefited from the flight to safety and the surge in energy prices. For these "old economy" giants, the current volatility is a tailwind, as they offer the dividends and tangible assets that investors crave when tech growth stalls. However, even these gains are double-edged, as $100-per-barrel oil acts as a "tax" on the broader economy, potentially dampening the industrial demand that many Dow components rely on.
The technology sector, led by Microsoft Corp. (NASDAQ: MSFT), finds itself in a precarious middle ground. While MSFT continues to report strong growth in its cloud divisions, its stock has shed significant value from its 2025 peak of $540, now trading near $395. The market is increasingly skeptical of the $30 billion quarterly spending required to maintain AI infrastructure, especially as interest rates remain "higher for longer" due to the energy-driven inflation spike. If the Dow is to break 48,400, it will likely require a coordinated rally from these tech leaders alongside a stabilization in the financial sector.
Broader Significance and Historical Precedents
The battle for 48,400 is more than just a technical chart pattern; it reflects a broader shift in the global economic order. The current situation mirrors the "oil shock" periods of the 1970s, where geopolitical events outside the control of the Federal Reserve dictated domestic market performance. Just as the break above 40,000 in 2024 signaled a new era of post-pandemic growth, a failure at 48,400 would suggest that the 2025 bull market was a temporary peak fueled by AI hype that has now collided with the reality of global resource scarcity.
Regulatory and policy implications are also at the forefront. Federal Reserve Chair Jerome Powell, whose term expires in May 2026, is facing a "hawkish hold" dilemma. The February Consumer Price Index (CPI) came in "hot" at +0.3%, fueled by energy costs. This has forced the Fed to pause its rate-cutting cycle, much to the chagrin of equity bulls who were hoping for a liquidity injection to push the index past 50,000 again. The ripple effects of this policy shift are being felt by competitors and partners globally, as the "strong dollar" environment persists, further complicating the earnings outlook for multinational Dow components.
Looking Ahead: The March 17-18 FOMC Pivot
The short-term trajectory of the Dow depends almost entirely on the outcome of the FOMC meeting scheduled for March 17–18, 2026. If the Fed signals a willingness to engage in "Quantitative Easing Lite"—managing reserves to ensure market liquidity despite inflation—the index could easily blast through the 48,400 resistance level by the end of the week. Such a move would likely trigger a wave of algorithmic buying, as momentum-tracking funds pivot back to a "long" stance.
Long-term, the Dow may need to undergo a strategic adaptation. If energy prices remain elevated, we may see a multi-year rotation away from high-multiple tech stocks and toward industrial and energy players. This "Great Rotation" would require investors to recalibrate their expectations for growth. The potential for a "relief rally" is high, but the path to a sustainable new all-time high above 50,000 is fraught with challenges, including the need for a resolution to the Hormuz blockade and a stabilization of the healthcare sector's regulatory environment.
Closing Thoughts for the Strategic Investor
The 48,400 mark on the Dow Jones Industrial Average represents a critical crossroads. It is the gatekeeper between a temporary correction and a full-blown bear market. As of mid-March 2026, the index is showing signs of resilience, but the weight of its high-priced components like UnitedHealth and the looming threat of stagflation keep the bulls in check.
Investors should watch for a daily close above 48,400 on high volume as a confirmation of a trend reversal. Conversely, a break below the 46,200 support level would be a signal to move into more defensive postures. Moving forward, the market’s focus will remain squarely on energy prices and the Federal Reserve’s final moves under the current leadership. In the coming months, the ability of the Dow to digest these shocks will determine if the 50,000 milestone of early 2026 was a peak for the decade or merely a pit stop on the way to further growth.
This content is intended for informational purposes only and is not financial advice