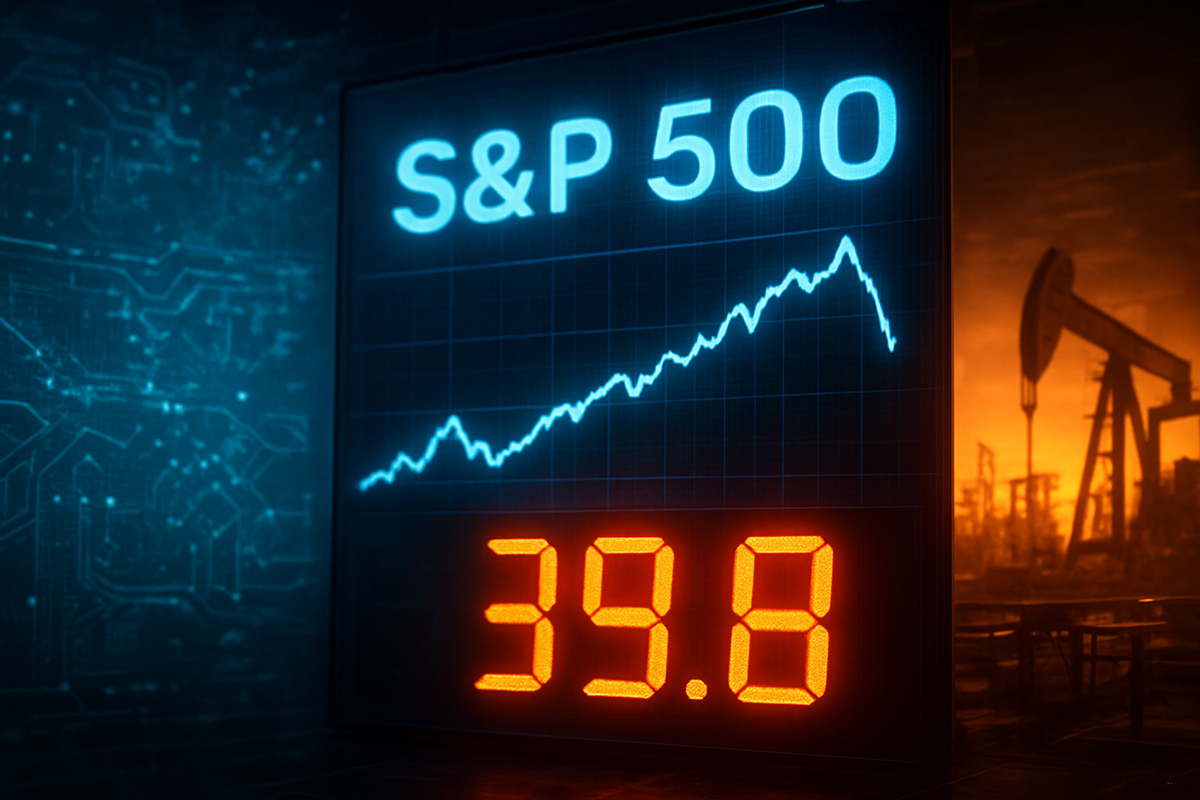
The S&P 500 index reached a sobering milestone on March 9, 2026, as the widely followed Shiller CAPE (Cyclically Adjusted Price-to-Earnings) ratio climbed to 39.8. This level marks the highest valuation for the U.S. stock market since the peak of the dot-com bubble in October 2000, signaling a potential overextension that has left institutional investors and retail traders alike on edge. The psychological weight of this figure, combined with a 3% year-to-date decline in the benchmark index, suggests that the "AI-driven honeymoon" of the past two years may be giving way to a period of painful price discovery.
The current market stumble, which saw the S&P 500 retreat to approximately 6,666 points from its January high of 7,002, is being fueled by a "perfect storm" of macroeconomic headwinds and valuation fatigue. While corporate earnings remain historically robust, the market's refusal to reward even significant "triple beats" from tech giants indicates that investors are no longer willing to pay a premium for future growth that is already "priced for perfection." As the 39.8 CAPE ratio hovers dangerously close to the 44.2 all-time high set at the turn of the millennium, the specter of a structural correction loom large over the financial landscape.
The Nvidia Paradox and the Road to 39.8
The journey to this valuation precipice began in late 2024, as the "AI Supercycle" moved from theoretical promise to massive infrastructure spending. However, by early 2026, the narrative shifted from "growth at any cost" to "profit verification." A critical turning point occurred on February 25, 2026, when Nvidia Corp. (NASDAQ: NVDA) reported record-breaking quarterly earnings that exceeded all analyst expectations. Paradoxically, the stock tumbled 5.5% in the following session, a move that analysts have dubbed the "Nvidia Paradox." This event served as a clarion call that valuation multiples had reached a ceiling where even flawless execution was insufficient to drive further gains.
The immediate catalyst for the 3% year-to-date slide was a series of compounding geopolitical and domestic shocks. In early February, escalating tensions in the Middle East led to a partial closure of the Strait of Hormuz, causing Brent crude oil to surge past $105 per barrel. This inflationary spike was followed by a disastrous February jobs report, which revealed a surprise loss of 92,000 jobs—the first contraction in years. Furthermore, the market is still digesting the implications of the "One Big Beautiful Bill" Act (OBBBA), a $5 trillion fiscal stimulus package that has introduced significant uncertainty regarding future trade tariffs and corporate tax structures.
Stakeholders, from pension fund managers to high-frequency trading firms, are now reassessing their exposure to the "Magnificent Seven." The concentration of the S&P 500 in these tech behemoths has reached a historic high, with nearly 40% of the index's total weight tied to the fortunes of a handful of companies. This lack of breadth has made the entire index hypersensitive to any cooling in the tech sector. Initial reactions from major brokerages have been defensive, with many shifting their "overweight" ratings from technology to more tangible sectors like energy and basic materials.
Winners and Losers: The Great Sector Rotation
The primary "losers" in this valuation reset are the high-multiple technology hyperscalers that led the 2025 rally. Microsoft Corp. (NASDAQ: MSFT), Apple Inc. (NASDAQ: AAPL), and Alphabet Inc. (NASDAQ: GOOGL) are all facing what some call "existential repricing." As AI agents begin to disrupt traditional software-as-a-service (SaaS) models, investors are questioning the long-term sustainability of the per-seat licensing fees that have long been the bedrock of Silicon Valley's revenue. Amazon.com, Inc. (NASDAQ: AMZN) has also seen its valuation compressed as rising energy costs for its massive data center footprint begin to eat into its cloud margins.
Conversely, a new group of "winners" has emerged in what is being called the "Atoms over Bits" trade. This rotation favors companies with physical assets and exposure to the re-industrialization of the American economy. Exxon Mobil Corp. (NYSE: XOM) and Chevron Corp. (NYSE: CVX) have seen double-digit gains YTD, bolstered by the $100+ oil environment and new production agreements. These companies are being viewed as "inflation hedges" in a market where digital growth is stalling.
Industrial giants like Caterpillar Inc. (NYSE: CAT) and Deere & Company (NYSE: DE) are also outperforming the broader market. Caterpillar, in particular, has hit record highs as it supplies the heavy machinery required for the domestic manufacturing boom incentivized by the OBBBA. Similarly, materials firms like Nucor Corp. (NYSE: NUE) and Freeport-McMoRan Inc. (NYSE: FCX) are benefiting from a structural shortage in copper and steel, driven by the ongoing expansion of the national power grid and the hardware-intensive nature of the second-phase AI rollout.
Analyzing the 39.8 Threshold: Historical Echoes
The broader significance of a 39.8 CAPE ratio cannot be overstated. When the market trades at a 130% premium to its long-term historical mean of 17.3, it enters a "danger zone" where historically, 10-year forward returns have averaged near zero. The comparison to the October 2000 dot-com crash is particularly haunting; back then, the bubble burst not because the internet failed to change the world, but because the price paid for that change was mathematically unsustainable. Today, the debate is whether AI is a similar "transformative but overpriced" technology.
This event fits into a broader trend of "sector fatigue." After years of digital dominance, the global economy is hitting physical bottlenecks. The "Code Phase" of AI—where software dominated—is giving way to the "Infrastructure Phase," where power, cooling, and raw materials are the limiting factors. This shift has massive regulatory implications, as the focus of the "One Big Beautiful Bill" Act shifts toward domestic resource security and trade protectionism. The ripple effects are already being felt by international partners, as the U.S. prioritizes "onshoring" critical components of the AI supply chain.
Historical precedents suggest that such high valuations are often cured by either a long period of sideways trading (a "time correction") or a sharp, sudden drawdown (a "price correction"). In 2000, the market chose the latter. However, bulls argue that today’s leaders are far more profitable than the "dot-coms" of yesteryear. While the S&P 500's concentration is a risk, the underlying cash flows of the top ten companies are real and growing, providing a "safety net" that was absent twenty-five years ago.
The Road Ahead: Volatility and Strategic Pivots
In the short term, the market is likely to remain volatile as it awaits the next round of inflation data and Federal Reserve commentary. Investors should prepare for a potential strategic pivot among the "Magnificent Seven" toward cost-cutting and dividend increases to justify their valuations in a higher-rate environment. We may see an "M&A frenzy" as cash-rich tech giants look to acquire smaller, hardware-focused firms to secure their supply chains and physical infrastructure.
The "Atoms over Bits" trade is expected to gain further momentum throughout 2026. Market opportunities will likely emerge in the nuclear power sector and specialized materials required for advanced data center cooling. However, a major challenge remains: if the tech-heavy NASDAQ continues to slide, it may eventually drag the rest of the market down through forced liquidations and margin calls, regardless of the strength of the energy or industrial sectors.
Long-term, the 2026 valuation alarm might be remembered as the moment the "AI Hype" matured into "AI Industrialization." The potential for a "soft landing" remains, but it would require a significant deceleration in inflation and a stabilization of geopolitical tensions in the Middle East. If these factors do not align, the 3% YTD decline could be the precursor to a much more significant re-valuation of the entire U.S. equity market.
Conclusion: A Market at a Crossroads
The S&P 500 valuation alarm of March 9, 2026, serves as a stark reminder that even the most revolutionary technologies cannot escape the gravity of historical valuation norms. With the Shiller CAPE at 39.8, the market has reached a point where "perfect" is the expected minimum, leaving no room for error in a world of rising oil prices and geopolitical instability. The 3% year-to-date decline is not just a dip; it is a signal that the market's internal mechanics are shifting toward tangible assets and physical infrastructure.
Moving forward, the market is likely to be characterized by "valuation sensitivity." Investors should move away from speculative growth and toward companies with strong balance sheets and "moats" built on physical assets. The coming months will be a test of whether the "AI winners" can sustain their earnings growth in the face of macro headwinds, or if the 2026 "alarm" will turn into a full-scale retreat.
For the remainder of the year, watch for the "Great Sector Rotation" to intensify. The performance of the Dow Jones Industrial Average relative to the NASDAQ 100 will be a key indicator of whether the market can successfully broaden out or if the tech-led malaise will define the year. In this environment, caution is the watchword; as history shows, when the CAPE ratio approaches 40, the margin for error disappears.
This content is intended for informational purposes only and is not financial advice.