


Industrial products distributor Applied Industrial (NYSE: AIT) reported Q3 CY2025 results topping the market’s revenue expectations, with sales up 9.2% year on year to $1.2 billion. Its GAAP profit of $2.63 per share was 6% above analysts’ consensus estimates.
Is now the time to buy Applied Industrial? Find out by accessing our full research report, it’s free for active Edge members.
Applied Industrial (AIT) Q3 CY2025 Highlights:
- Revenue: $1.2 billion vs analyst estimates of $1.19 billion (9.2% year-on-year growth, 1.1% beat)
- EPS (GAAP): $2.63 vs analyst estimates of $2.48 (6% beat)
- Adjusted EBITDA: $146.3 million vs analyst estimates of $142.7 million (12.2% margin, 2.5% beat)
- EPS (GAAP) guidance for the full year is $10.48 at the midpoint, roughly in line with what analysts were expecting
- Operating Margin: 10.8%, in line with the same quarter last year
- Free Cash Flow Margin: 9.3%, down from 11.1% in the same quarter last year
- Organic Revenue rose 3% year on year vs analyst estimates of 2.1% growth (87.2 basis point beat)
- Market Capitalization: $9.82 billion
Neil A. Schrimsher, Applied’s President & Chief Executive Officer, commented, “We had a solid first quarter, delivering double-digit EBITDA and EPS growth that exceeded our expectations. Total sales increased 9% year over year on stronger organic sales growth and M&A contribution. Organic growth was led by our shorter-cycle Service Center segment reflecting traction with internal initiatives, firming technical MRO demand, and our industry position. Engineered Solutions segment organic sales were relatively unchanged from the prior year but remain favorably positioned with segment orders continuing to trend positive. In addition, favorable operating leverage, cost control, and channel execution resulted in first quarter EBITDA margins of 12.2% expanding nearly 50 basis points over the prior-year period, which was ahead of our guidance. Overall, I’m encouraged by our teams’ ongoing execution and the positive momentum building across Applied.”
Company Overview
Formerly called The Ohio Ball Bearing Company, Applied Industrial (NYSE: AIT) distributes industrial products–everything from power tools to industrial valves–and services to a wide variety of industries.
Revenue Growth
A company’s long-term performance is an indicator of its overall quality. Any business can put up a good quarter or two, but the best consistently grow over the long haul. Thankfully, Applied Industrial’s 8.3% annualized revenue growth over the last five years was decent. Its growth was slightly above the average industrials company and shows its offerings resonate with customers.
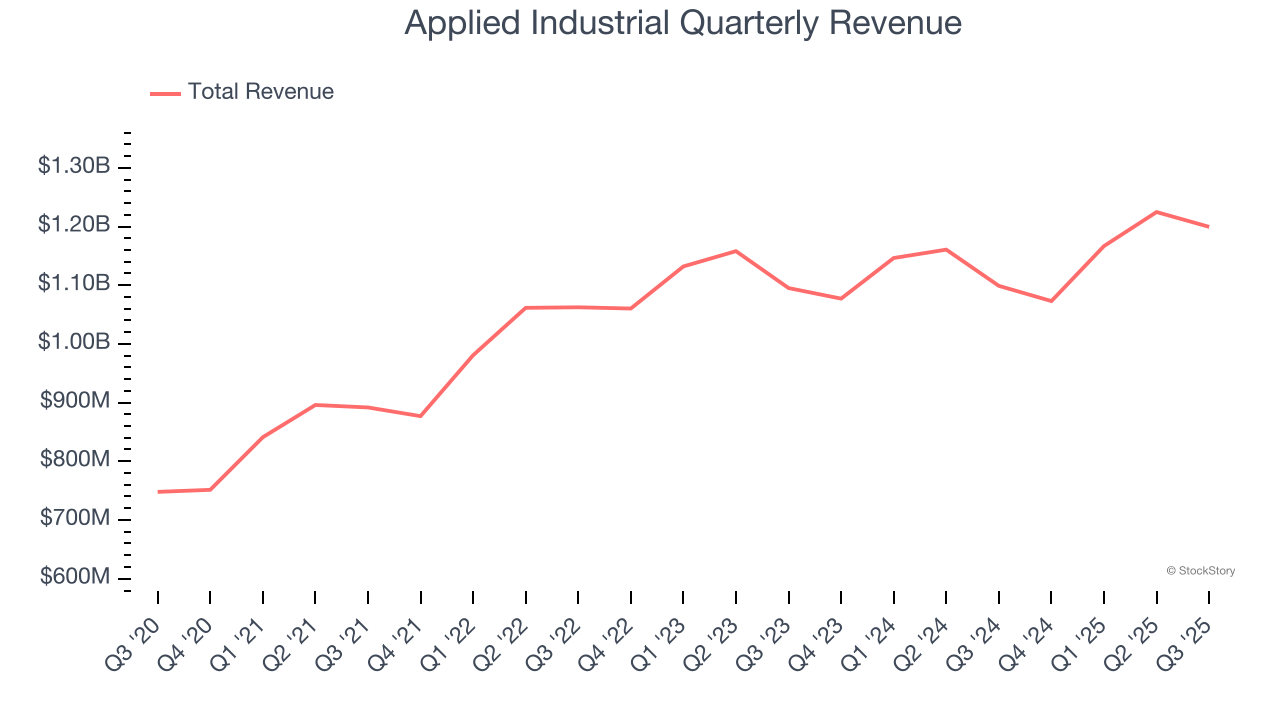
Long-term growth is the most important, but within industrials, a half-decade historical view may miss new industry trends or demand cycles. Applied Industrial’s recent performance shows its demand has slowed as its annualized revenue growth of 2.4% over the last two years was below its five-year trend. 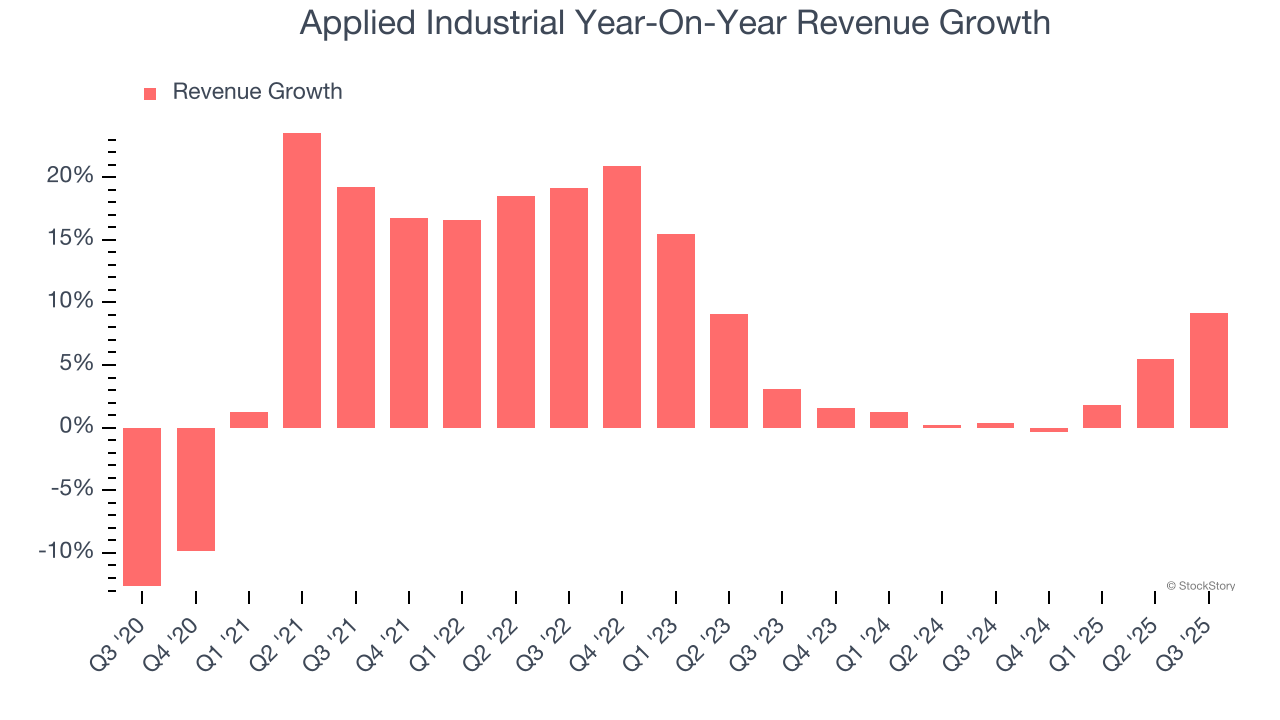
Applied Industrial also reports organic revenue, which strips out one-time events like acquisitions and currency fluctuations that don’t accurately reflect its fundamentals. Over the last two years, Applied Industrial’s organic revenue was flat. Because this number is lower than its two-year revenue growth, we can see that some mixture of acquisitions and foreign exchange rates boosted its headline results. 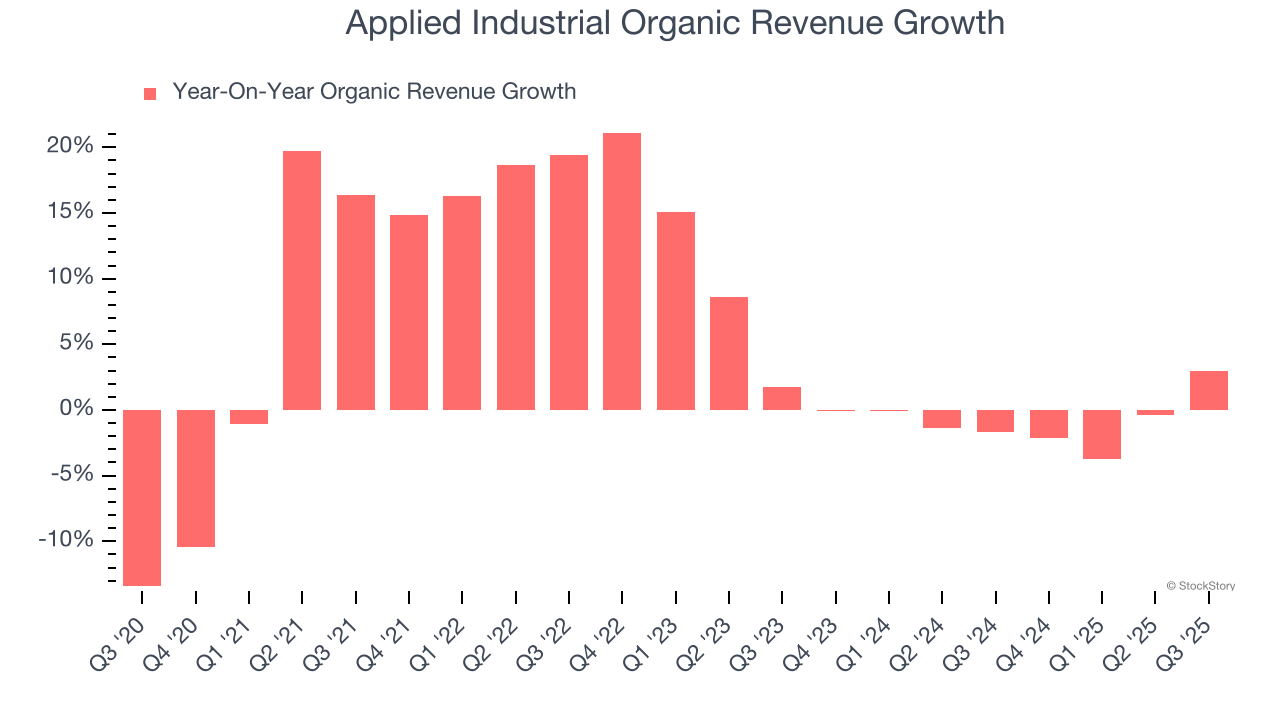
This quarter, Applied Industrial reported year-on-year revenue growth of 9.2%, and its $1.2 billion of revenue exceeded Wall Street’s estimates by 1.1%.
Looking ahead, sell-side analysts expect revenue to grow 5.1% over the next 12 months. Although this projection implies its newer products and services will spur better top-line performance, it is still below the sector average.
Unless you’ve been living under a rock, it should be obvious by now that generative AI is going to have a huge impact on how large corporations do business. While Nvidia and AMD are trading close to all-time highs, we prefer a lesser-known (but still profitable) stock benefiting from the rise of AI. Click here to access our free report one of our favorites growth stories.
Operating Margin
Applied Industrial has managed its cost base well over the last five years. It demonstrated solid profitability for an industrials business, producing an average operating margin of 10.3%. This result was particularly impressive because of its low gross margin, which is mostly a factor of what it sells and takes huge shifts to move meaningfully. Companies have more control over their operating margins, and it’s a show of well-managed operations if they’re high when gross margins are low.
Looking at the trend in its profitability, Applied Industrial’s operating margin rose by 2.6 percentage points over the last five years, as its sales growth gave it operating leverage.
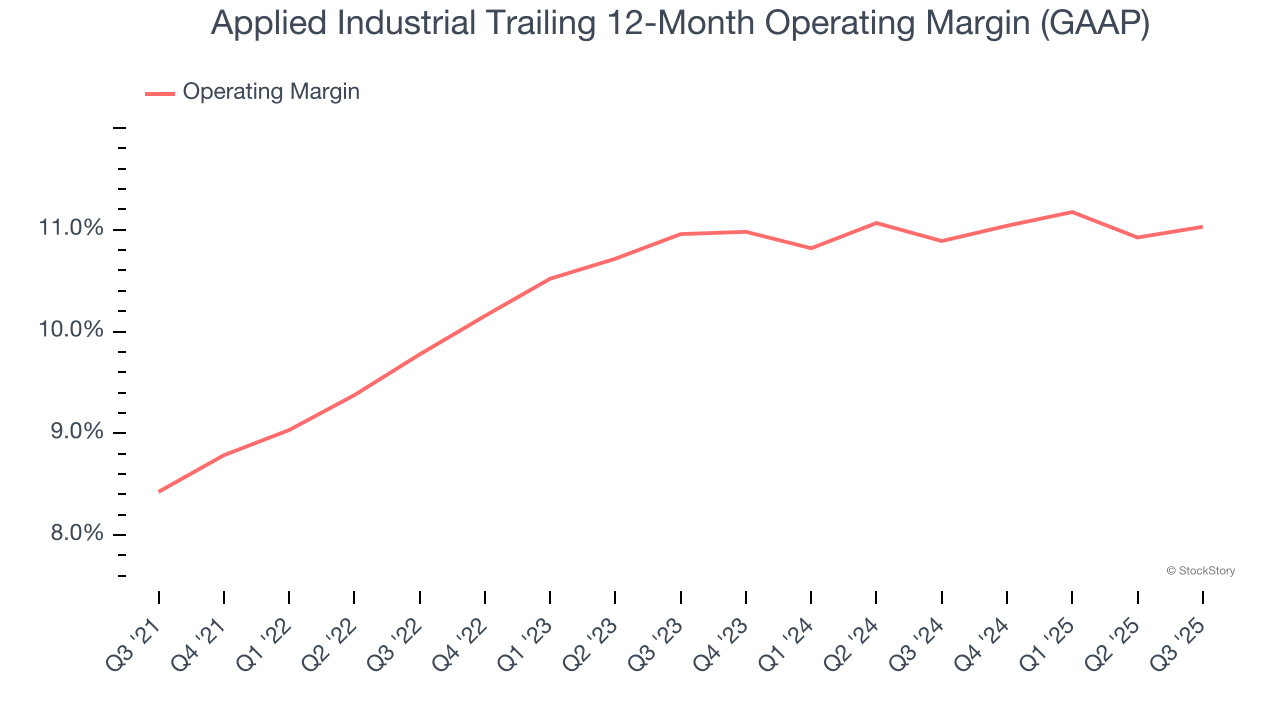
This quarter, Applied Industrial generated an operating margin profit margin of 10.8%, in line with the same quarter last year. This indicates the company’s cost structure has recently been stable.
Earnings Per Share
We track the long-term change in earnings per share (EPS) for the same reason as long-term revenue growth. Compared to revenue, however, EPS highlights whether a company’s growth is profitable.
Applied Industrial’s EPS grew at an astounding 84% compounded annual growth rate over the last five years, higher than its 8.3% annualized revenue growth. This tells us the company became more profitable on a per-share basis as it expanded.
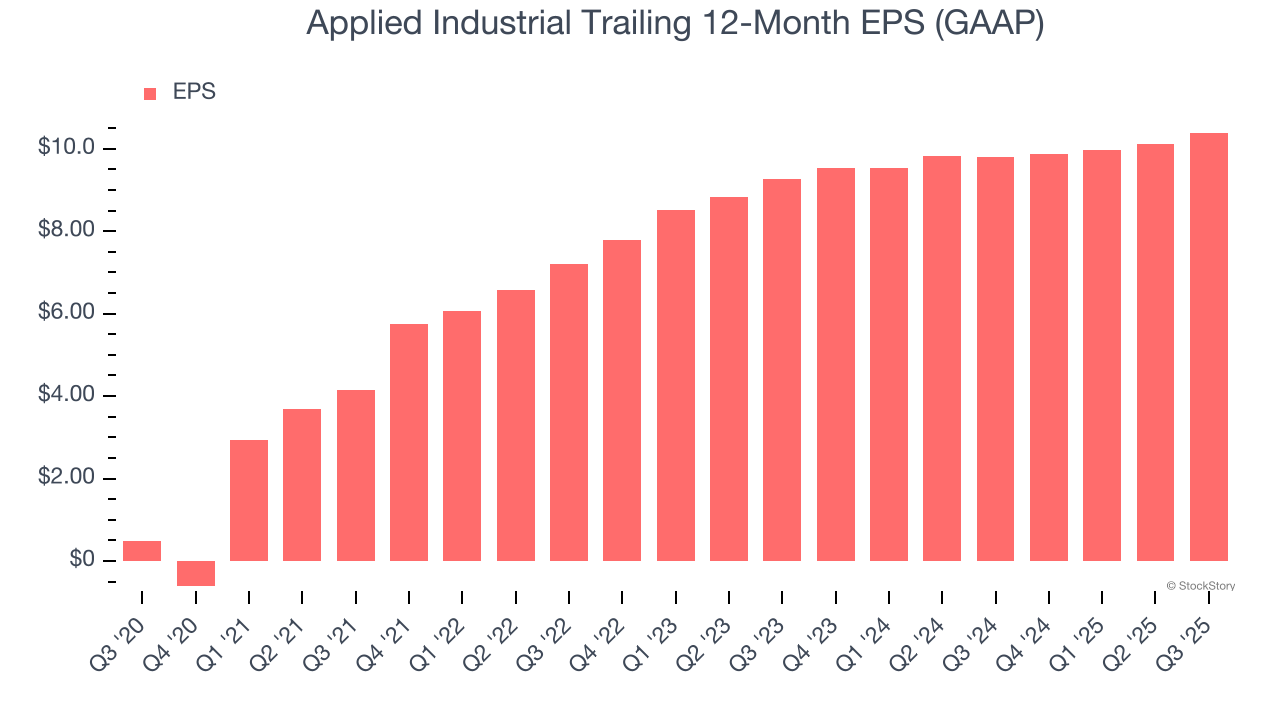
Diving into the nuances of Applied Industrial’s earnings can give us a better understanding of its performance. As we mentioned earlier, Applied Industrial’s operating margin was flat this quarter but expanded by 2.6 percentage points over the last five years. On top of that, its share count shrank by 2.1%. These are positive signs for shareholders because improving profitability and share buybacks turbocharge EPS growth relative to revenue growth. 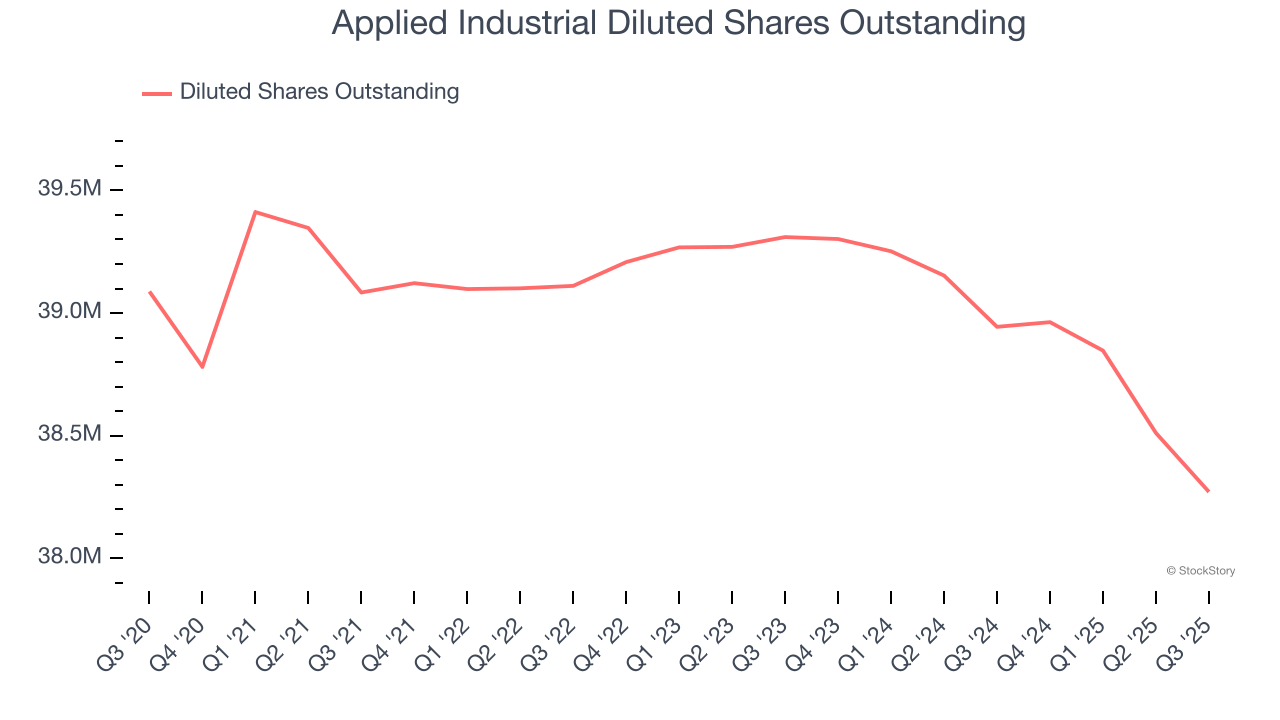
Like with revenue, we analyze EPS over a more recent period because it can provide insight into an emerging theme or development for the business.
For Applied Industrial, its two-year annual EPS growth of 5.9% was lower than its five-year trend. We hope its growth can accelerate in the future.
In Q3, Applied Industrial reported EPS of $2.63, up from $2.36 in the same quarter last year. This print beat analysts’ estimates by 6%. Over the next 12 months, Wall Street expects Applied Industrial’s full-year EPS of $10.39 to grow 3.8%.
Key Takeaways from Applied Industrial’s Q3 Results
It was encouraging to see Applied Industrial beat analysts’ EBITDA expectations this quarter. We were also happy its revenue narrowly outperformed Wall Street’s estimates. On the other hand, its full-year EPS guidance slightly missed. Overall, this print had some key positives. The stock traded up 3% to $267.90 immediately after reporting.
Big picture, is Applied Industrial a buy here and now? We think that the latest quarter is only one piece of the longer-term business quality puzzle. Quality, when combined with valuation, can help determine if the stock is a buy. We cover that in our actionable full research report which you can read here, it’s free for active Edge members.


