


Electronics manufacturing services provider Benchmark (NYSE: BHE) reported revenue ahead of Wall Street’s expectations in Q2 CY2025, but sales fell by 3.5% year on year to $642.3 million. On the other hand, next quarter’s revenue guidance of $660 million was less impressive, coming in 1.1% below analysts’ estimates. Its non-GAAP profit of $0.55 per share was 1.9% above analysts’ consensus estimates.
Is now the time to buy Benchmark? Find out by accessing our full research report, it’s free.
Benchmark (BHE) Q2 CY2025 Highlights:
- Revenue: $642.3 million vs analyst estimates of $638.7 million (3.5% year-on-year decline, 0.6% beat)
- Adjusted EPS: $0.55 vs analyst estimates of $0.54 (1.9% beat)
- Revenue Guidance for Q3 CY2025 is $660 million at the midpoint, below analyst estimates of $667.1 million
- Adjusted EPS guidance for Q3 CY2025 is $0.59 at the midpoint, above analyst estimates of $0.58
- Operating Margin: 3.2%, down from 4.3% in the same quarter last year
- Free Cash Flow was -$15.13 million, down from $48.24 million in the same quarter last year
- Market Capitalization: $1.45 billion
“Benchmark’s second quarter results continue to validate our strategy. We are the partner of choice for complex product execution, from concept through design to global delivery and support. Our second quarter progress was measured by sequential growth across most of our sectors with continued strength in A&D and solid recovery in the Industrial and Medical sectors. Even more encouraging was that we achieved a multi-year record in new bookings during the quarter,” said Jeff Benck, Benchmark’s President and CEO.
Company Overview
Operating as a critical behind-the-scenes partner for complex technology products since 1979, Benchmark Electronics (NYSE: BHE) provides advanced manufacturing, engineering, and technology solutions for original equipment manufacturers across aerospace, medical, industrial, and technology sectors.
Revenue Growth
A company’s long-term sales performance is one signal of its overall quality. Any business can put up a good quarter or two, but many enduring ones grow for years.
With $2.59 billion in revenue over the past 12 months, Benchmark is a mid-sized business services company, which sometimes brings disadvantages compared to larger competitors benefiting from better economies of scale.
As you can see below, Benchmark’s sales grew at a mediocre 4.6% compounded annual growth rate over the last five years. This shows it couldn’t generate demand in any major way and is a tough starting point for our analysis.
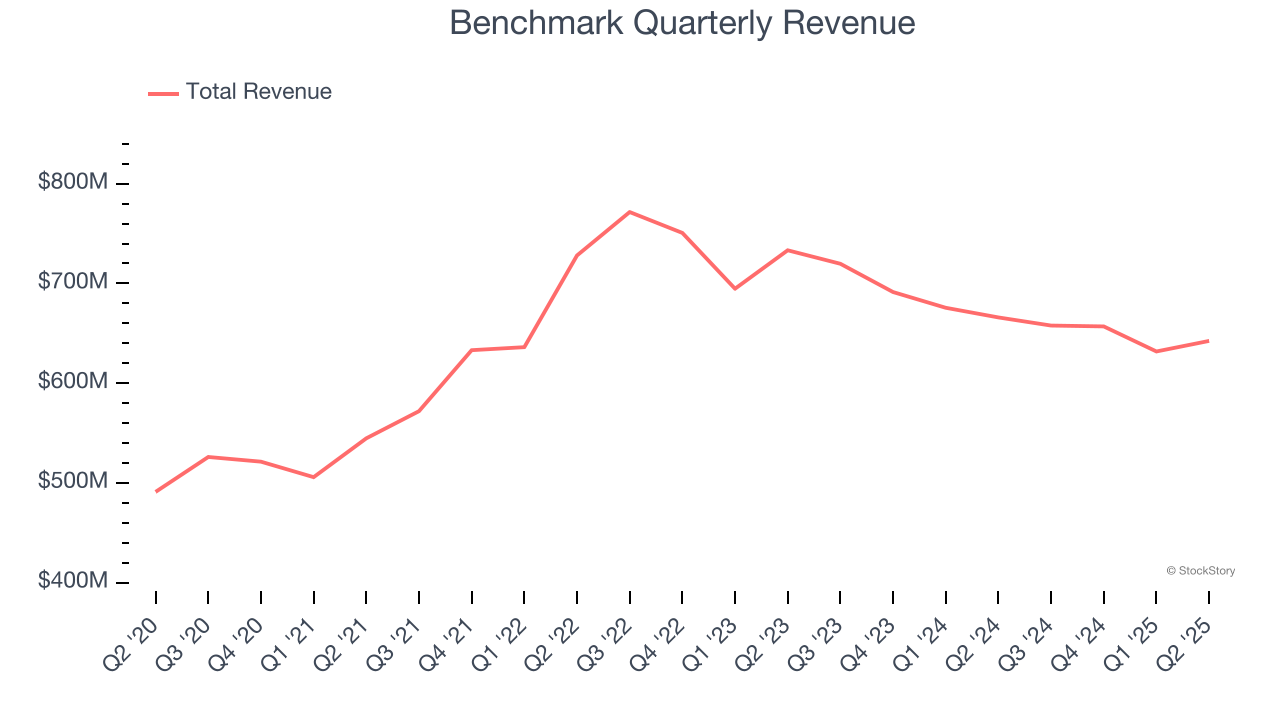
We at StockStory place the most emphasis on long-term growth, but within business services, a half-decade historical view may miss recent innovations or disruptive industry trends. Benchmark’s performance shows it grew in the past but relinquished its gains over the last two years, as its revenue fell by 6.3% annually. 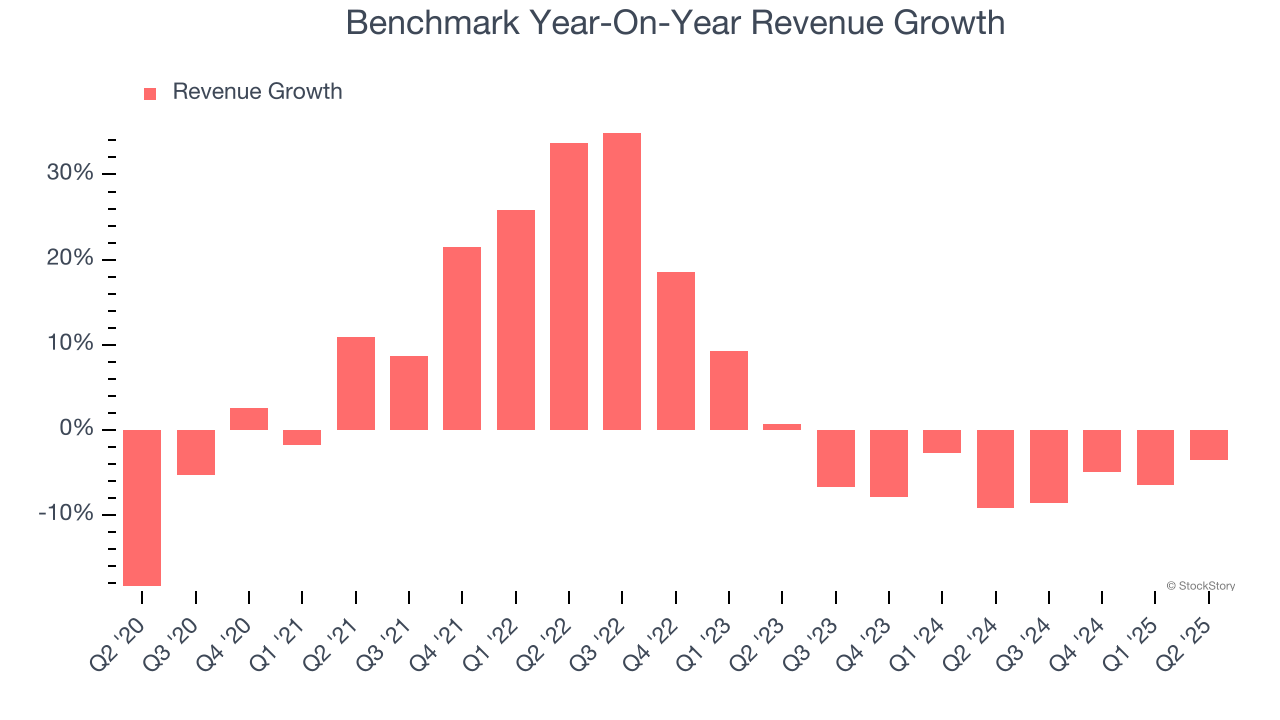
This quarter, Benchmark’s revenue fell by 3.5% year on year to $642.3 million but beat Wall Street’s estimates by 0.6%. Company management is currently guiding for flat sales next quarter.
Looking further ahead, sell-side analysts expect revenue to grow 7.5% over the next 12 months, an improvement versus the last two years. This projection is noteworthy and suggests its newer products and services will catalyze better top-line performance.
Unless you’ve been living under a rock, it should be obvious by now that generative AI is going to have a huge impact on how large corporations do business. While Nvidia and AMD are trading close to all-time highs, we prefer a lesser-known (but still profitable) stock benefiting from the rise of AI. Click here to access our free report one of our favorites growth stories.
Operating Margin
Benchmark was profitable over the last five years but held back by its large cost base. Its average operating margin of 3.6% was weak for a business services business.
On the plus side, Benchmark’s operating margin rose by 1.4 percentage points over the last five years, as its sales growth gave it operating leverage.
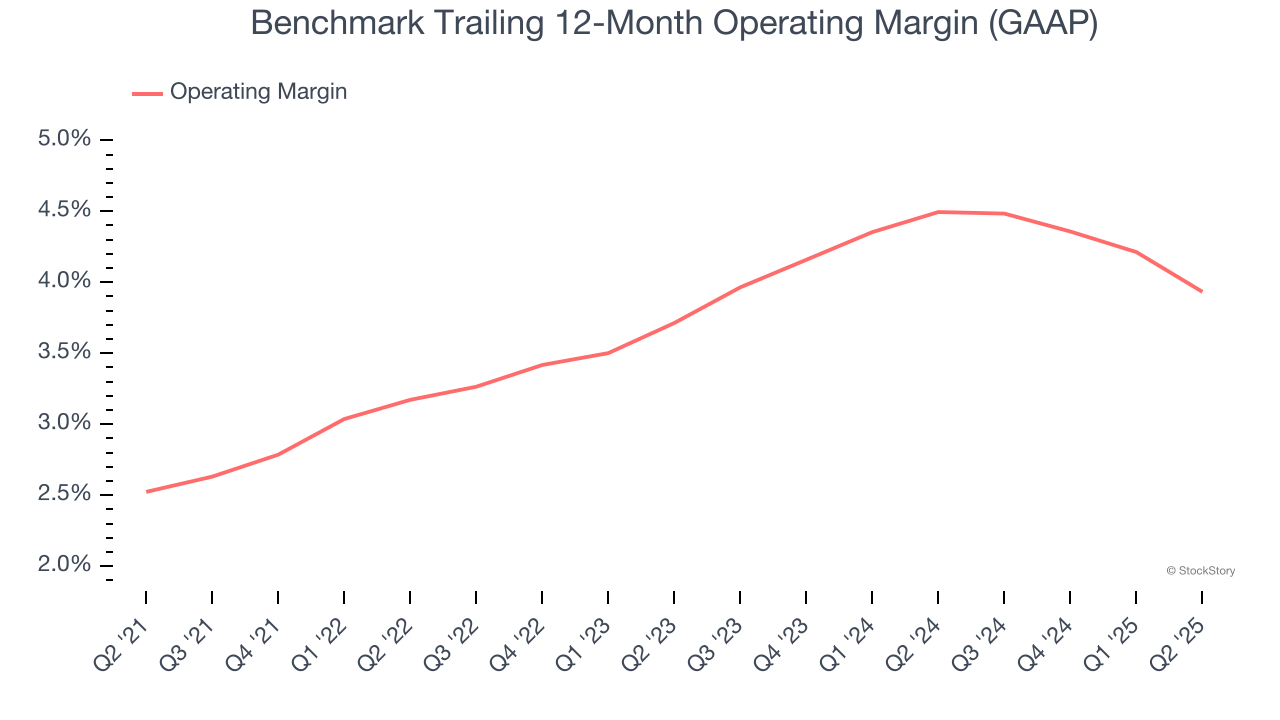
This quarter, Benchmark generated an operating margin profit margin of 3.2%, down 1.1 percentage points year on year. This reduction is quite minuscule and indicates the company’s overall cost structure has been relatively stable.
Earnings Per Share
We track the long-term change in earnings per share (EPS) for the same reason as long-term revenue growth. Compared to revenue, however, EPS highlights whether a company’s growth is profitable.
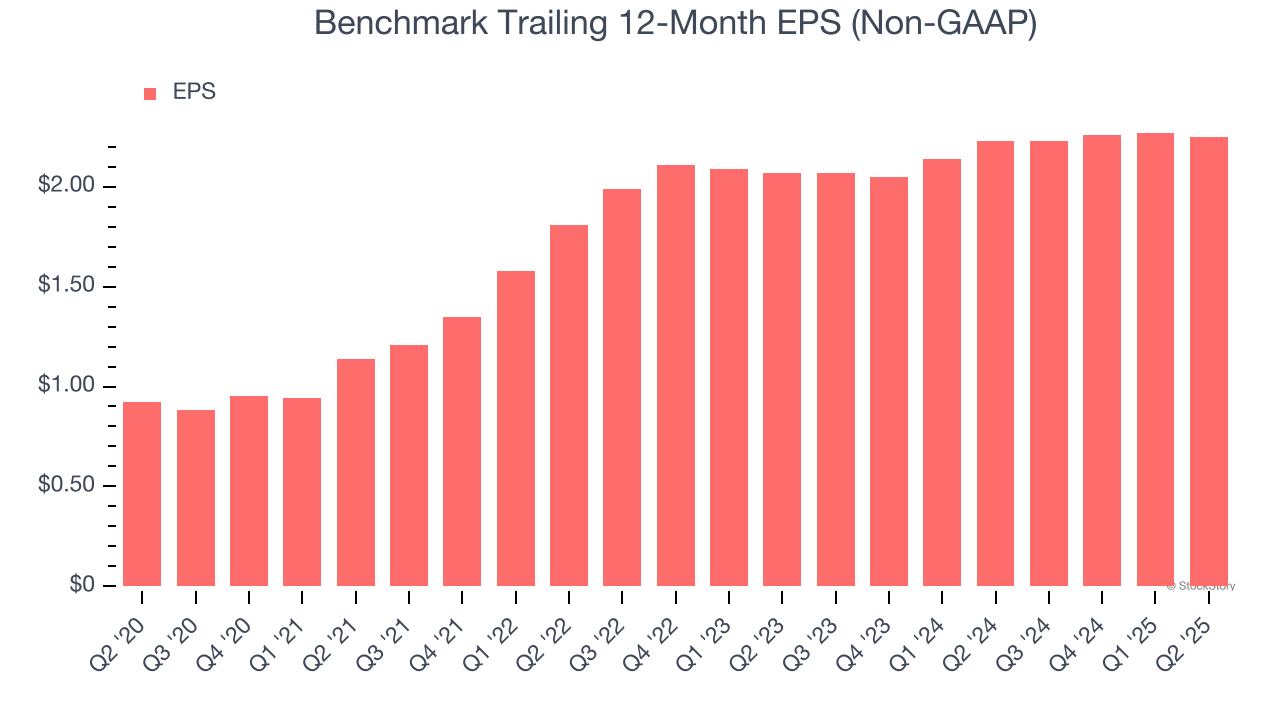
Benchmark’s EPS grew at an astounding 19.6% compounded annual growth rate over the last five years, higher than its 4.6% annualized revenue growth. This tells us the company became more profitable on a per-share basis as it expanded.
Diving into the nuances of Benchmark’s earnings can give us a better understanding of its performance. As we mentioned earlier, Benchmark’s operating margin declined this quarter but expanded by 1.4 percentage points over the last five years. This was the most relevant factor (aside from the revenue impact) behind its higher earnings; interest expenses and taxes can also affect EPS but don’t tell us as much about a company’s fundamentals.
Like with revenue, we analyze EPS over a more recent period because it can provide insight into an emerging theme or development for the business.
For Benchmark, its two-year annual EPS growth of 4.3% was lower than its five-year trend. We hope its growth can accelerate in the future.
In Q2, Benchmark reported adjusted EPS at $0.55, down from $0.57 in the same quarter last year. Despite falling year on year, this print beat analysts’ estimates by 1.9%. Over the next 12 months, Wall Street expects Benchmark’s full-year EPS of $2.25 to grow 10.4%.
Key Takeaways from Benchmark’s Q2 Results
It was good to see Benchmark narrowly top analysts’ EPS guidance for next quarter expectations this quarter. We were also happy its EPS outperformed Wall Street’s estimates. On the other hand, operating margin declined when compared to the same period last year, and the company's revenue guidance for next quarter slightly missed. Overall, this was a weaker quarter. The stock traded down 8.4% to $35.97 immediately after reporting.
Should you buy the stock or not? When making that decision, it’s important to consider its valuation, business qualities, as well as what has happened in the latest quarter. We cover that in our actionable full research report which you can read here, it’s free.


