


IT distribution giant TD SYNNEX (NYSE: SNX) reported Q4 CY2025 results beating Wall Street’s revenue expectations, with sales up 9.7% year on year to $17.38 billion. The company expects next quarter’s revenue to be around $15.5 billion, close to analysts’ estimates. Its non-GAAP profit of $3.83 per share was 2.7% above analysts’ consensus estimates.
Is now the time to buy TD SYNNEX? Find out by accessing our full research report, it’s free for active Edge members.
TD SYNNEX (SNX) Q4 CY2025 Highlights:
- Revenue: $17.38 billion vs analyst estimates of $16.95 billion (9.7% year-on-year growth, 2.6% beat)
- Adjusted EPS: $3.83 vs analyst estimates of $3.73 (2.7% beat)
- Adjusted EBITDA: $527.1 million vs analyst estimates of $515.2 million (3% margin, 2.3% beat)
- Revenue Guidance for Q1 CY2026 is $15.5 billion at the midpoint, roughly in line with what analysts were expecting
- Adjusted EPS guidance for Q1 CY2026 is $3.25 at the midpoint, above analyst estimates of $3.21
- Operating Margin: 2.3%, in line with the same quarter last year
- Free Cash Flow Margin: 8.2%, up from 3.2% in the same quarter last year
- Market Capitalization: $12.3 billion
Company Overview
Serving as the crucial middleman in the technology supply chain, TD SYNNEX (NYSE: SNX) is a global technology distributor that connects thousands of IT manufacturers with resellers, helping businesses access hardware, software, and technology solutions.
Revenue Growth
Reviewing a company’s long-term sales performance reveals insights into its quality. Any business can put up a good quarter or two, but many enduring ones grow for years.
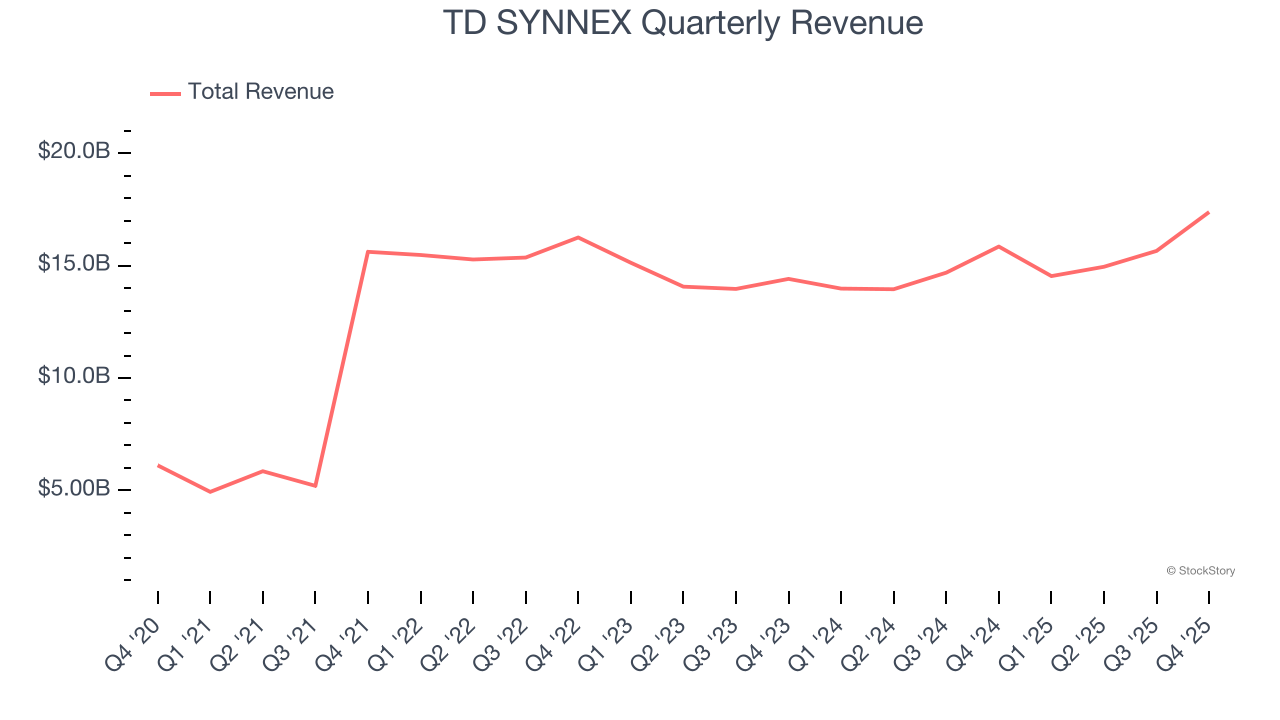
With $62.51 billion in revenue over the past 12 months, TD SYNNEX is a behemoth in the business services sector and benefits from economies of scale, giving it an edge in distribution. This also enables it to gain more leverage on its fixed costs than smaller competitors and the flexibility to offer lower prices.
As you can see below, TD SYNNEX’s 25.6% annualized revenue growth over the last five years was incredible. This shows it had high demand, a useful starting point for our analysis.
We at StockStory place the most emphasis on long-term growth, but within business services, a half-decade historical view may miss recent innovations or disruptive industry trends. TD SYNNEX’s recent performance shows its demand has slowed significantly as its annualized revenue growth of 4.2% over the last two years was well below its five-year trend. 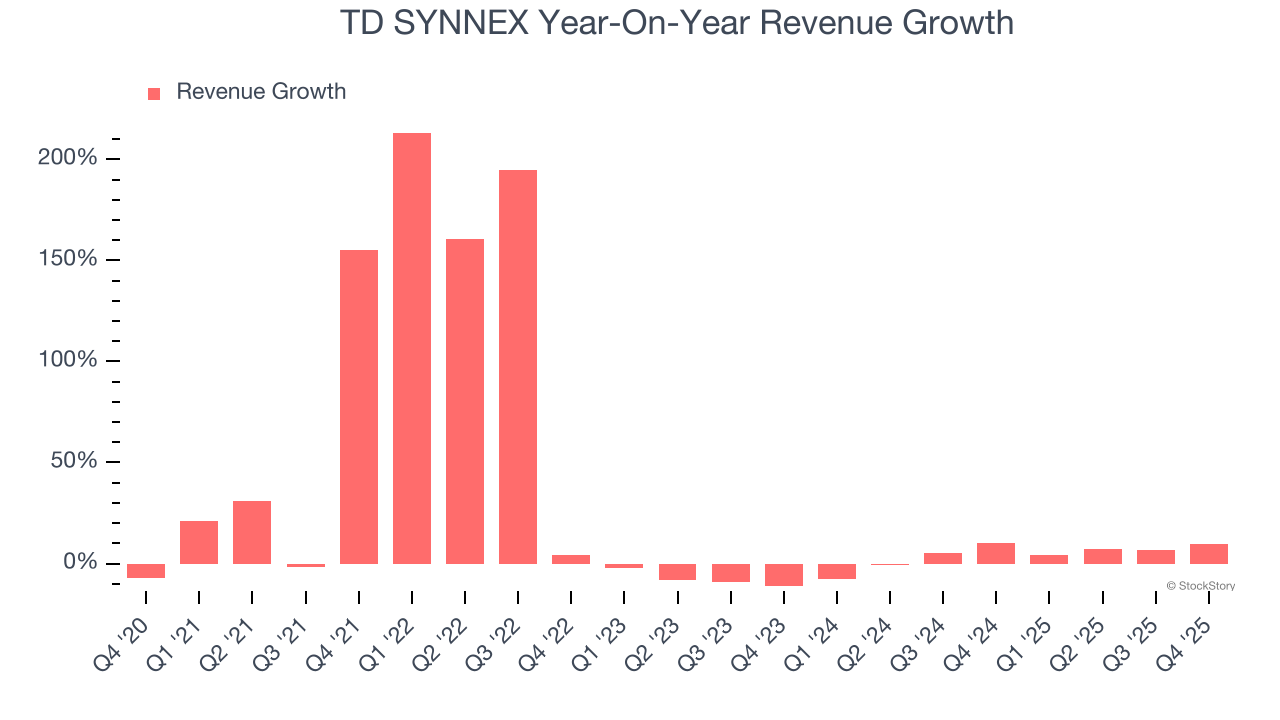
This quarter, TD SYNNEX reported year-on-year revenue growth of 9.7%, and its $17.38 billion of revenue exceeded Wall Street’s estimates by 2.6%. Company management is currently guiding for a 6.7% year-on-year increase in sales next quarter.
Looking further ahead, sell-side analysts expect revenue to grow 3.6% over the next 12 months, similar to its two-year rate. This projection doesn't excite us and suggests its newer products and services will not catalyze better top-line performance yet.
Software is eating the world and there is virtually no industry left that has been untouched by it. That drives increasing demand for tools helping software developers do their jobs, whether it be monitoring critical cloud infrastructure, integrating audio and video functionality, or ensuring smooth content streaming. Click here to access a free report on our 3 favorite stocks to play this generational megatrend.
Operating Margin
Operating margin is an important measure of profitability as it shows the portion of revenue left after accounting for all core expenses – everything from the cost of goods sold to advertising and wages. It’s also useful for comparing profitability across companies with different levels of debt and tax rates because it excludes interest and taxes.
TD SYNNEX’s operating margin might fluctuated slightly over the last 12 months but has remained more or less the same, averaging 2% over the last five years. This profitability was inadequate for a business services business and caused by its suboptimal cost structure.
Looking at the trend in its profitability, TD SYNNEX’s operating margin might fluctuated slightly but has generally stayed the same over the last five years. This raises questions about the company’s expense base because its revenue growth should have given it leverage on its fixed costs, resulting in better economies of scale and profitability.
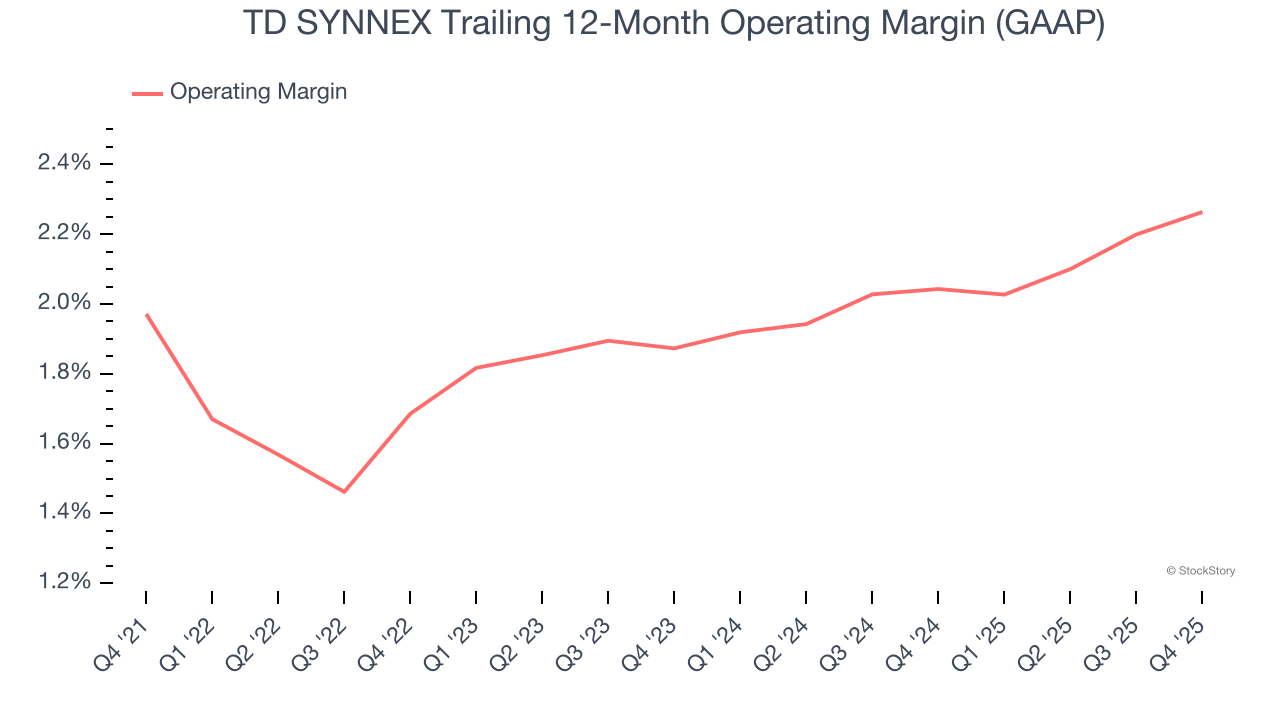
In Q4, TD SYNNEX generated an operating margin profit margin of 2.3%, in line with the same quarter last year. This indicates the company’s overall cost structure has been relatively stable.
Earnings Per Share
Revenue trends explain a company’s historical growth, but the long-term change in earnings per share (EPS) points to the profitability of that growth – for example, a company could inflate its sales through excessive spending on advertising and promotions.
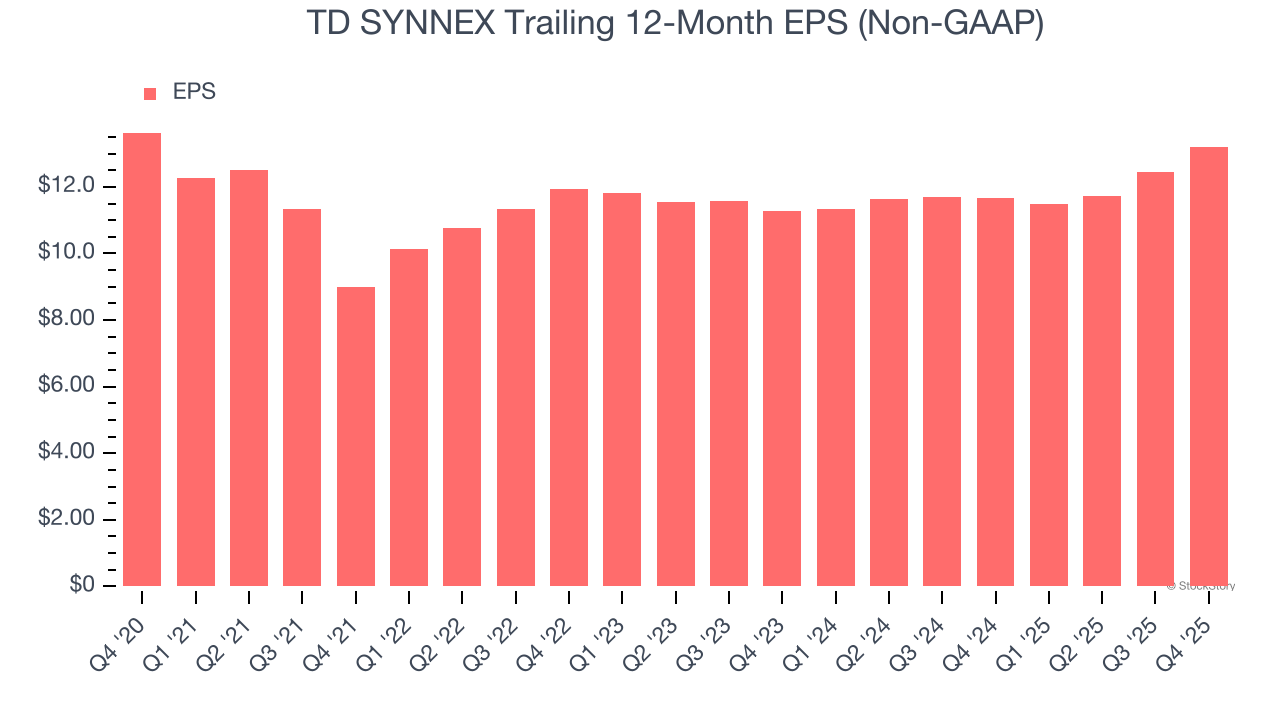
TD SYNNEX’s flat EPS over the last five years was below its 25.6% annualized revenue growth. However, its operating margin didn’t change during this time, telling us that non-fundamental factors such as interest and taxes affected its ultimate earnings.
Like with revenue, we analyze EPS over a more recent period because it can provide insight into an emerging theme or development for the business.
For TD SYNNEX, its two-year annual EPS growth of 8.2% was higher than its five-year trend. Accelerating earnings growth is almost always an encouraging data point.
In Q4, TD SYNNEX reported adjusted EPS of $3.83, up from $3.09 in the same quarter last year. This print beat analysts’ estimates by 2.7%. Over the next 12 months, Wall Street expects TD SYNNEX’s full-year EPS of $13.20 to grow 10.4%.
Key Takeaways from TD SYNNEX’s Q4 Results
We enjoyed seeing TD SYNNEX beat analysts’ revenue expectations this quarter. We were also happy its EPS guidance for next quarter narrowly outperformed Wall Street’s estimates. Overall, this print had some key positives. The stock traded up 1.7% to $153.50 immediately after reporting.
Sure, TD SYNNEX had a solid quarter, but if we look at the bigger picture, is this stock a buy? The latest quarter does matter, but not nearly as much as longer-term fundamentals and valuation, when deciding if the stock is a buy. We cover that in our actionable full research report which you can read here, it’s free for active Edge members.


