


Identification solutions manufacturer Brady (NYSE: BRC) beat Wall Street’s revenue expectations in Q4 CY2025, with sales up 7.7% year on year to $384.1 million. Its non-GAAP profit of $1.09 per share was in line with analysts’ consensus estimates.
Is now the time to buy Brady? Find out by accessing our full research report, it’s free.
Brady (BRC) Q4 CY2025 Highlights:
- Revenue: $384.1 million vs analyst estimates of $378.6 million (7.7% year-on-year growth, 1.5% beat)
- Adjusted EPS: $1.09 vs analyst estimates of $1.09 (in line)
- Adjusted EBITDA: $71.98 million vs analyst estimates of $76.4 million (18.7% margin, 5.8% miss)
- Management slightly raised its full-year Adjusted EPS guidance to $5.05 at the midpoint
- Operating Margin: 16.2%, in line with the same quarter last year
- Free Cash Flow Margin: 11%, up from 9.1% in the same quarter last year
- Market Capitalization: $4.49 billion
Commentary:“This quarter marks Brady’s 20th consecutive quarter of organic sales growth, alongside a significant improvement in segment profit within both our Americas & Asia and Europe & Australia regions,” said Brady’s President and Chief Executive Officer, Russell R. Shaller.
Company Overview
Founded in 1914 and evolving through more than a century of industrial innovation, Brady (NYSE: BRC) manufactures and supplies identification solutions and workplace safety products that help companies identify and protect their premises, products, and people.
Revenue Growth
Reviewing a company’s long-term sales performance reveals insights into its quality. Any business can experience short-term success, but top-performing ones enjoy sustained growth for years.
With $1.57 billion in revenue over the past 12 months, Brady is a mid-sized business services company, which sometimes brings disadvantages compared to larger competitors benefiting from better economies of scale. On the bright side, it can still flex high growth rates because it’s working from a smaller revenue base.
As you can see below, Brady’s 8.1% annualized revenue growth over the last five years was solid. This is an encouraging starting point for our analysis because it shows Brady’s demand was higher than many business services companies.
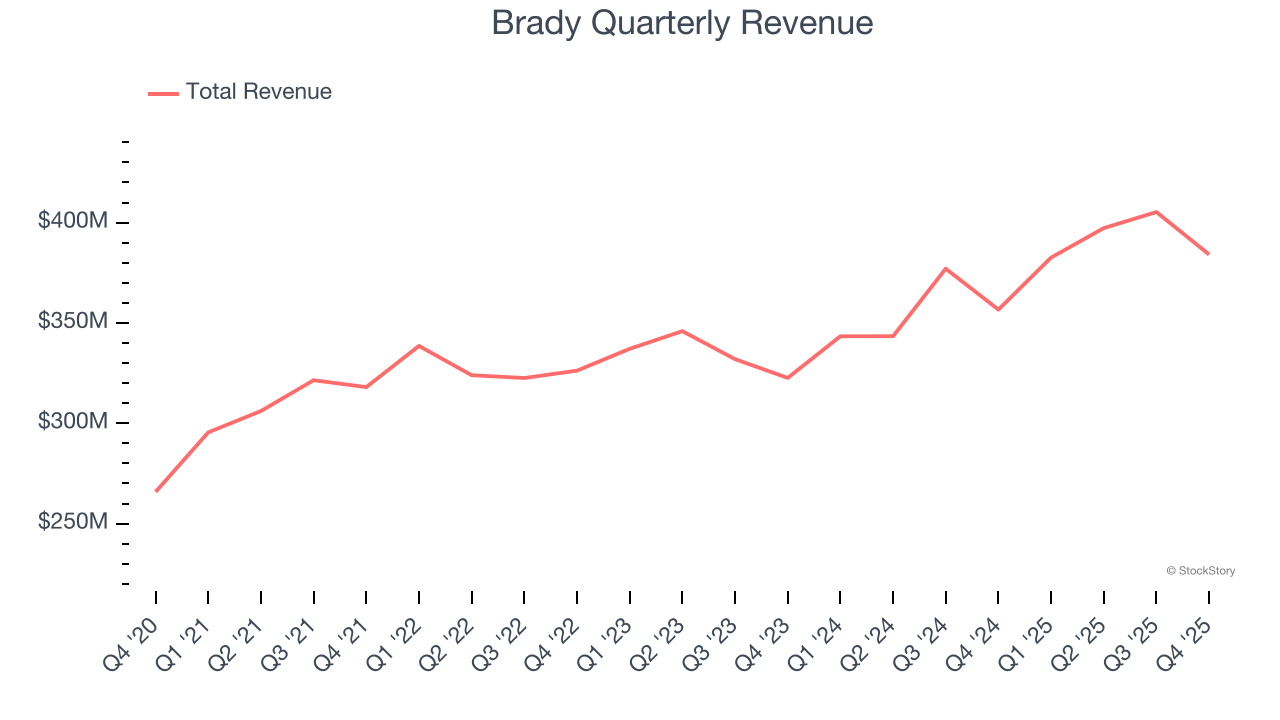
We at StockStory place the most emphasis on long-term growth, but within business services, a half-decade historical view may miss recent innovations or disruptive industry trends. Brady’s annualized revenue growth of 8.3% over the last two years aligns with its five-year trend, suggesting its demand was predictably strong. 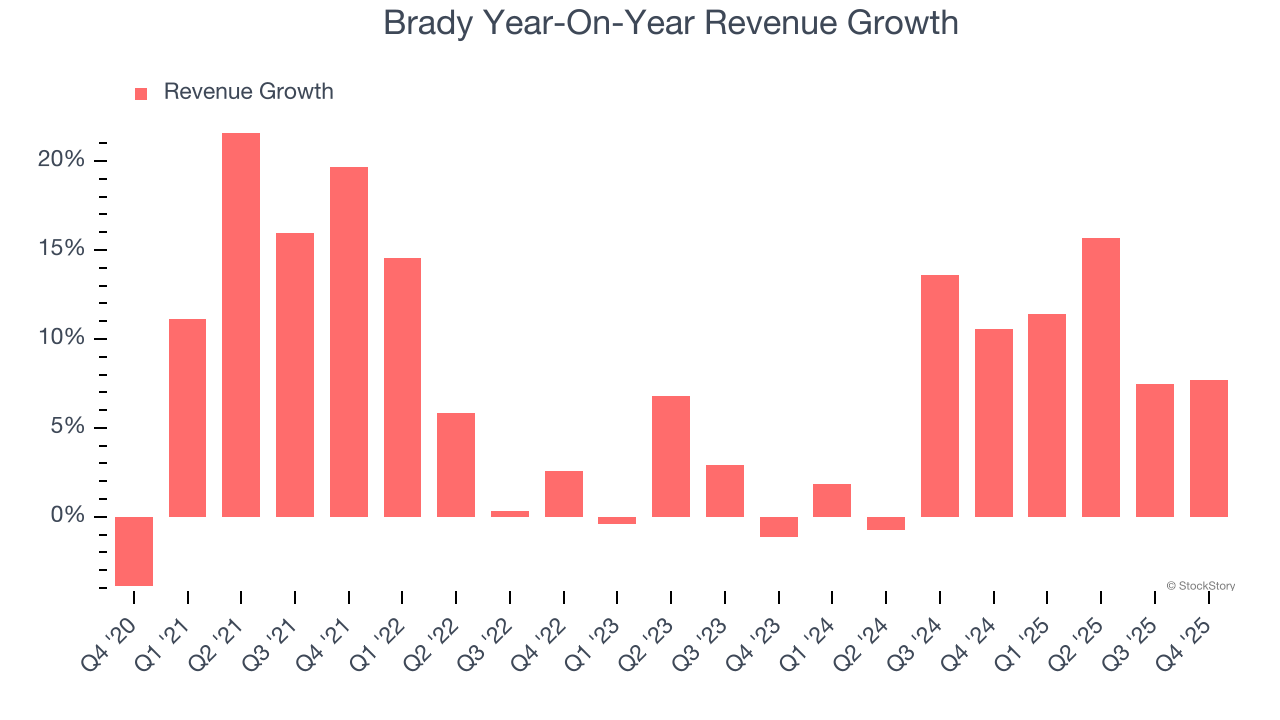
This quarter, Brady reported year-on-year revenue growth of 7.7%, and its $384.1 million of revenue exceeded Wall Street’s estimates by 1.5%.
Looking ahead, sell-side analysts expect revenue to grow 4.5% over the next 12 months, a deceleration versus the last two years. This projection is underwhelming and implies its products and services will see some demand headwinds. At least the company is tracking well in other measures of financial health.
The 1999 book Gorilla Game predicted Microsoft and Apple would dominate tech before it happened. Its thesis? Identify the platform winners early. Today, enterprise software companies embedding generative AI are becoming the new gorillas. a profitable, fast-growing enterprise software stock that is already riding the automation wave and looking to catch the generative AI next.
Operating Margin
Brady has been an efficient company over the last five years. It was one of the more profitable businesses in the business services sector, boasting an average operating margin of 16.6%.
Analyzing the trend in its profitability, Brady’s operating margin rose by 3.3 percentage points over the last five years, as its sales growth gave it operating leverage.
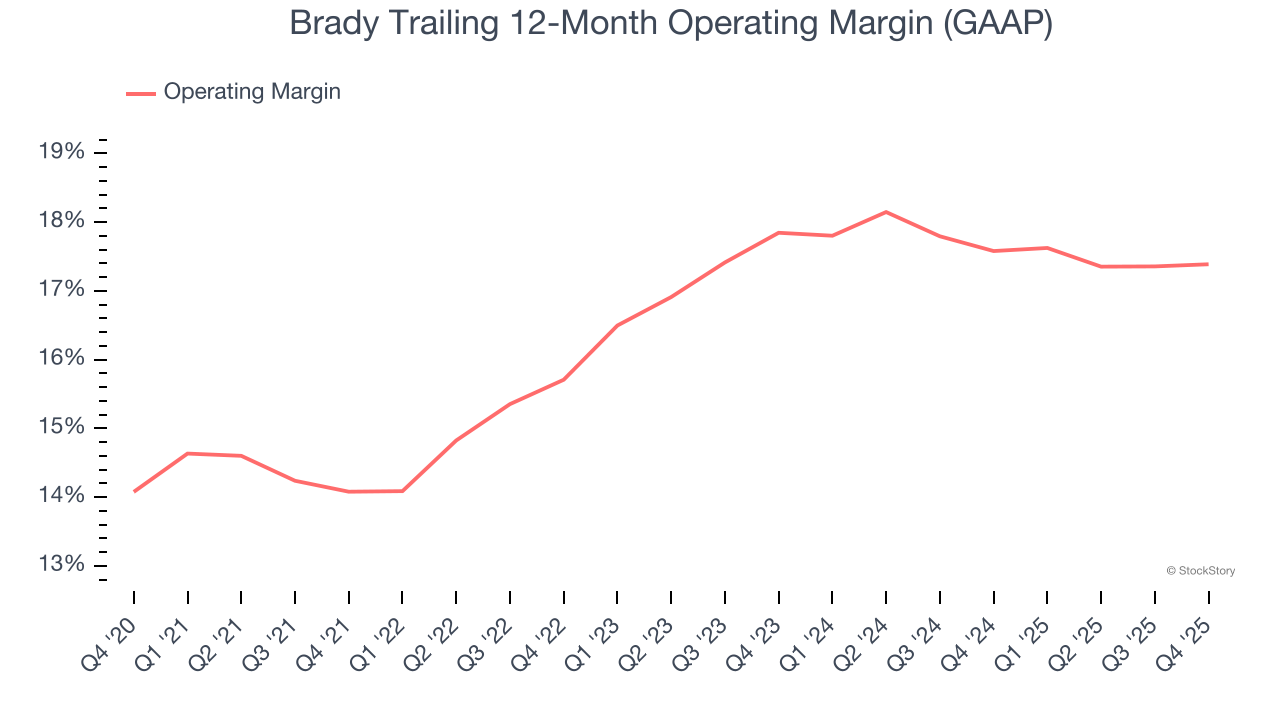
In Q4, Brady generated an operating margin profit margin of 16.2%, in line with the same quarter last year. This indicates the company’s overall cost structure has been relatively stable.
Earnings Per Share
Revenue trends explain a company’s historical growth, but the long-term change in earnings per share (EPS) points to the profitability of that growth – for example, a company could inflate its sales through excessive spending on advertising and promotions.
Brady’s EPS grew at an astounding 16.5% compounded annual growth rate over the last five years, higher than its 8.1% annualized revenue growth. This tells us the company became more profitable on a per-share basis as it expanded.
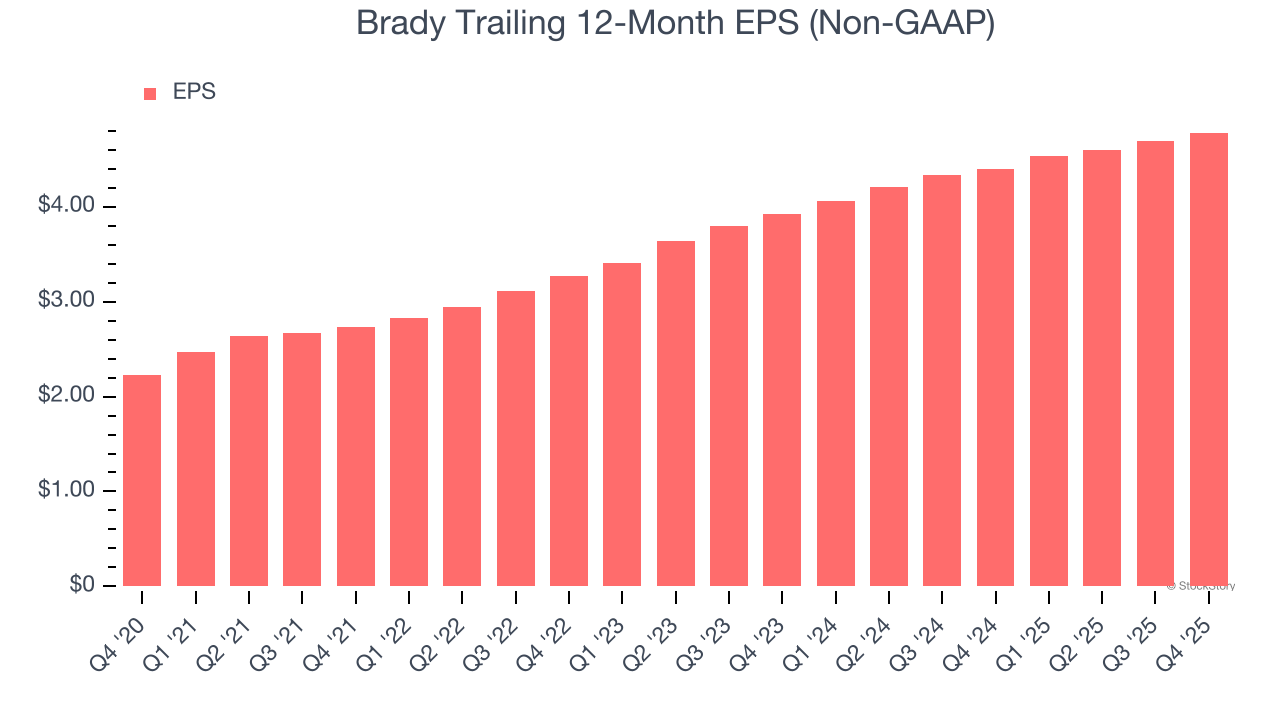
Diving into the nuances of Brady’s earnings can give us a better understanding of its performance. As we mentioned earlier, Brady’s operating margin was flat this quarter but expanded by 3.3 percentage points over the last five years. On top of that, its share count shrank by 8.7%. These are positive signs for shareholders because improving profitability and share buybacks turbocharge EPS growth relative to revenue growth. 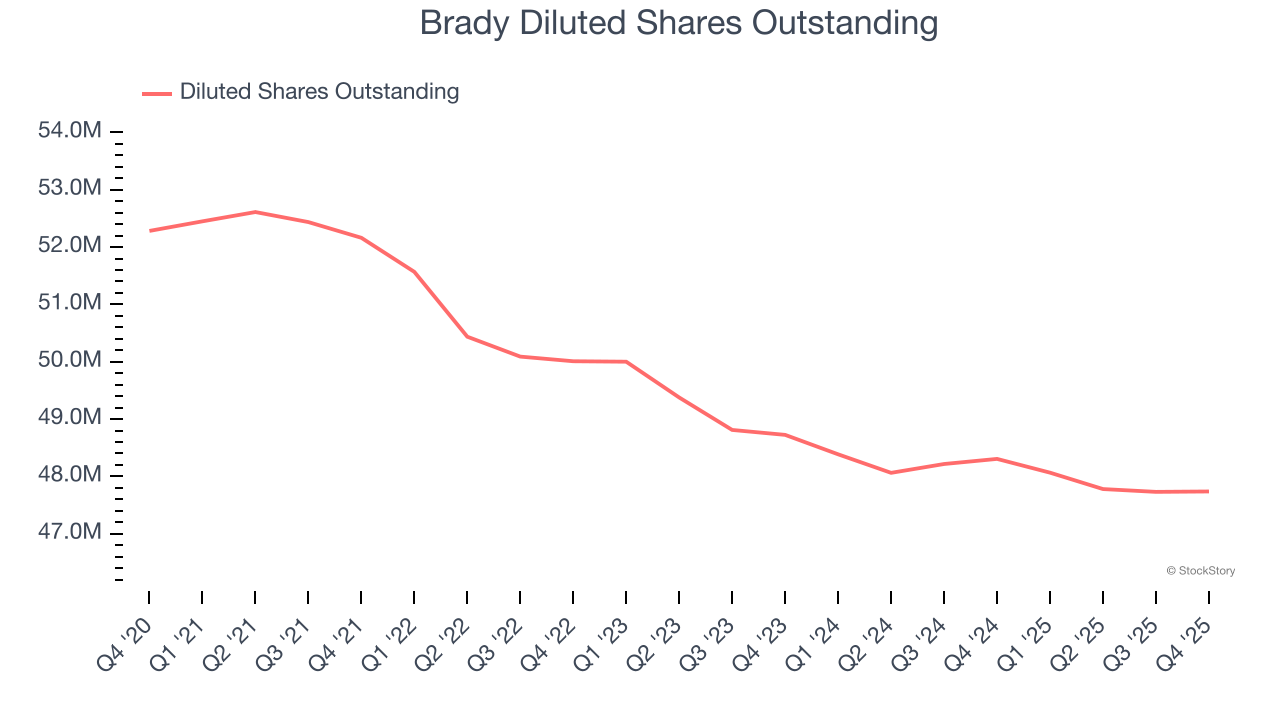
Like with revenue, we analyze EPS over a more recent period because it can provide insight into an emerging theme or development for the business.
For Brady, its two-year annual EPS growth of 10.4% was lower than its five-year trend. This wasn’t great, but at least the company was successful in other measures of financial health.
In Q4, Brady reported adjusted EPS of $1.09, up from $1 in the same quarter last year. This print was close to analysts’ estimates. Over the next 12 months, Wall Street expects Brady’s full-year EPS of $4.78 to grow 10.5%.
Key Takeaways from Brady’s Q4 Results
It was good to see Brady narrowly top analysts’ revenue expectations this quarter. Zooming out, we think this was a decent quarter. The stock remained flat at $95.26 immediately after reporting.
Should you buy the stock or not? If you’re making that decision, you should consider the bigger picture of valuation, business qualities, as well as the latest earnings. We cover that in our actionable full research report which you can read here (it’s free).


