


Wireless telecommunications provider Array (NYSE: AD) reported revenue ahead of Wall Street’s expectations in Q4 CY2025, but sales fell by 93.8% year on year to $60.33 million. Its GAAP profit of $0.48 per share was 39.6% above analysts’ consensus estimates.
Is now the time to buy Array? Find out by accessing our full research report, it’s free.
Array (AD) Q4 CY2025 Highlights:
- Revenue: $60.33 million vs analyst estimates of $56.37 million (93.8% year-on-year decline, 7% beat)
- EPS (GAAP): $0.48 vs analyst estimates of $0.34 (39.6% beat)
- Adjusted EBITDA: $52.09 million vs analyst estimates of $38.77 million (86.3% margin, 34.3% beat)
- Operating Margin: 14.3%, up from -0.9% in the same quarter last year
- Market Capitalization: $4.35 billion
"After a transformative 2025, Array enters 2026 with strong momentum," said Anthony Carlson, President and CEO.
Company Overview
Operating as a majority-owned subsidiary of Telephone and Data Systems since its founding in 1983, Array (NYSE: Array) is a regional wireless telecommunications provider serving 4.6 million customers across 21 states with mobile phone, internet, and IoT services.
Revenue Growth
A company’s long-term performance is an indicator of its overall quality. Any business can put up a good quarter or two, but many enduring ones grow for years.
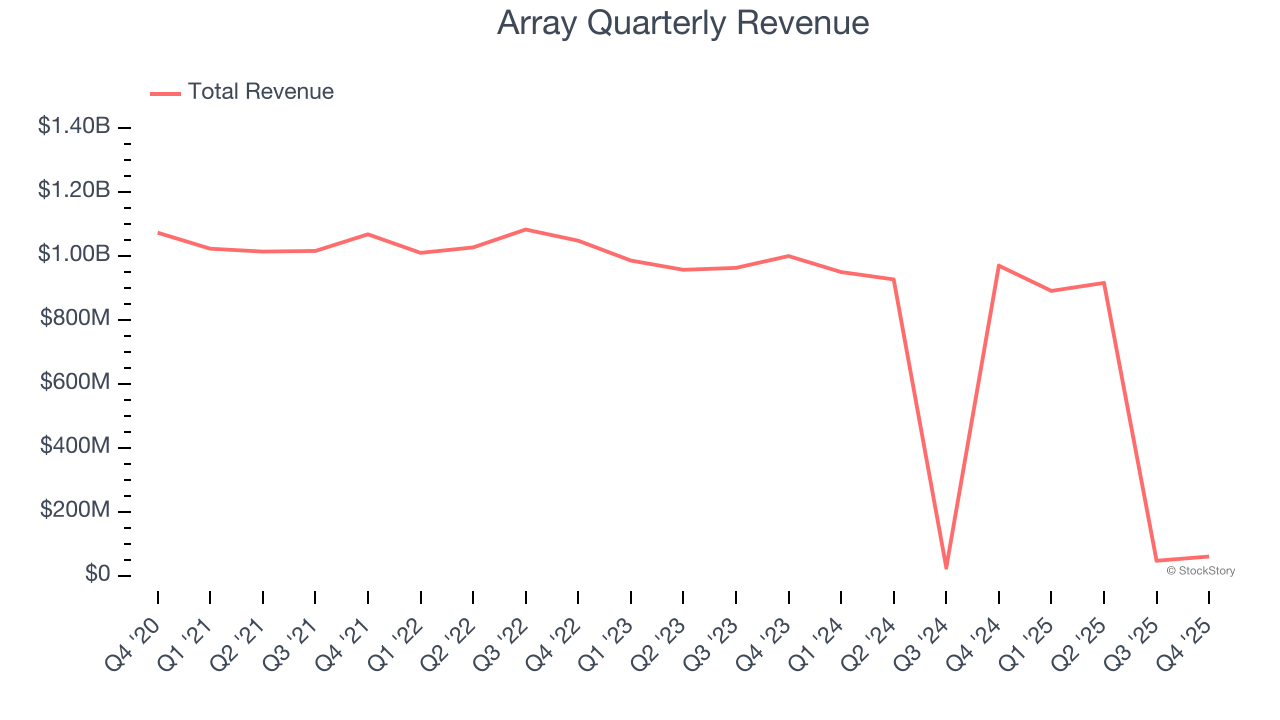
With $1.91 billion in revenue over the past 12 months, Array is a mid-sized business services company, which sometimes brings disadvantages compared to larger competitors benefiting from better economies of scale.
As you can see below, Array’s revenue declined by 13.9% per year over the last five years, a poor baseline for our analysis.
We at StockStory place the most emphasis on long-term growth, but within business services, a half-decade historical view may miss recent innovations or disruptive industry trends. Array’s recent performance shows its demand remained suppressed as its revenue has declined by 30% annually over the last two years. 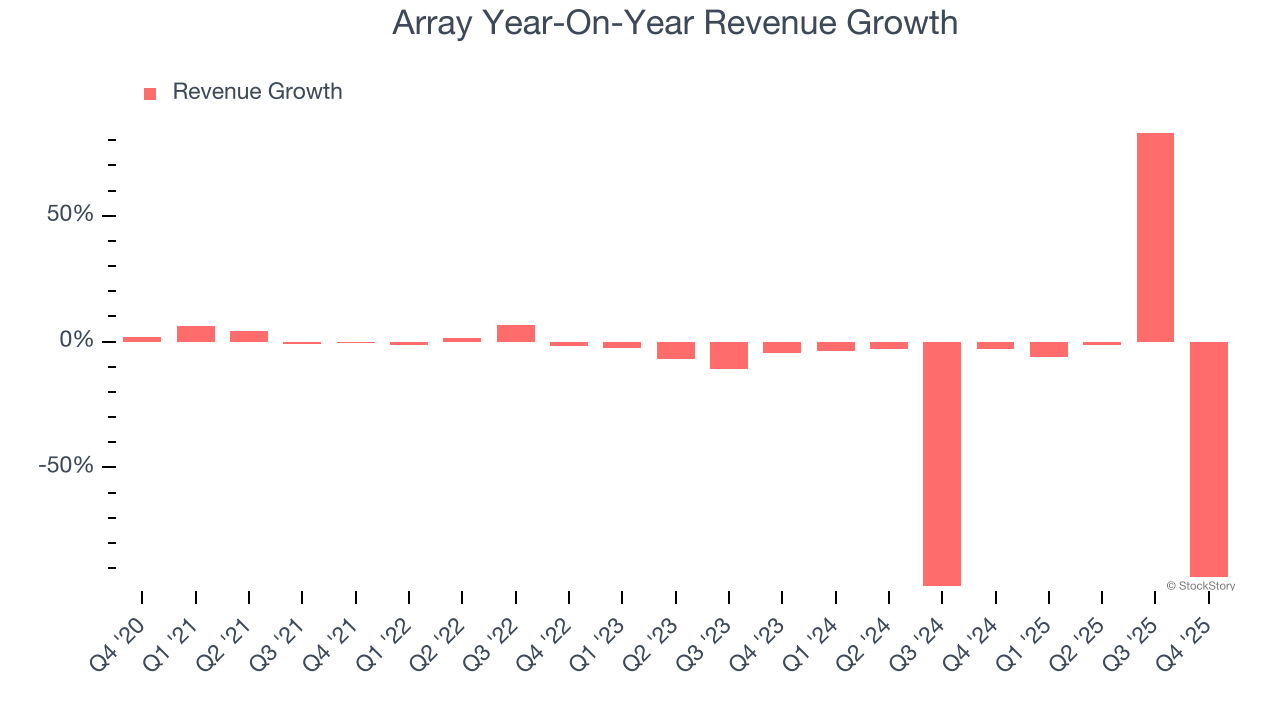
This quarter, Array’s revenue fell by 93.8% year on year to $60.33 million but beat Wall Street’s estimates by 7%.
Looking ahead, sell-side analysts expect revenue to decline by 88.4% over the next 12 months, a deceleration versus the last two years. This projection is underwhelming and suggests its products and services will face some demand challenges.
Microsoft, Alphabet, Coca-Cola, Monster Beverage—all began as under-the-radar growth stories riding a massive trend. We’ve identified the next one: a profitable AI semiconductor play Wall Street is still overlooking. Go here for access to our full report.
Operating Margin
Operating margin is one of the best measures of profitability because it tells us how much money a company takes home after subtracting all core expenses, like marketing and R&D.
Array was profitable over the last five years but held back by its large cost base. Its average operating margin of 1.9% was weak for a business services business.
Looking at the trend in its profitability, Array’s operating margin decreased by 2.5 percentage points over the last five years. Array’s performance was poor no matter how you look at it - it shows that costs were rising and it couldn’t pass them onto its customers.
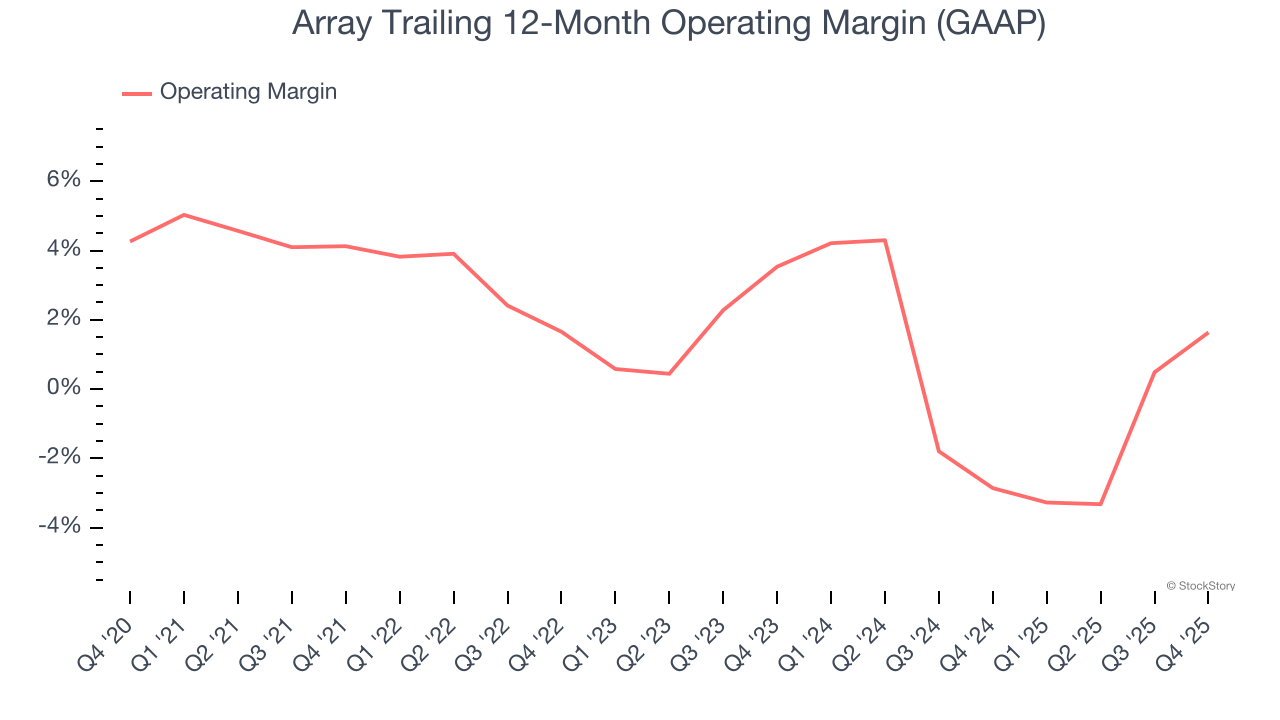
This quarter, Array generated an operating margin profit margin of 14.3%, up 15.2 percentage points year on year. This increase was a welcome development, especially since its revenue fell, showing it was more efficient because it scaled down its expenses.
Earnings Per Share
We track the long-term change in earnings per share (EPS) for the same reason as long-term revenue growth. Compared to revenue, however, EPS highlights whether a company’s growth is profitable.
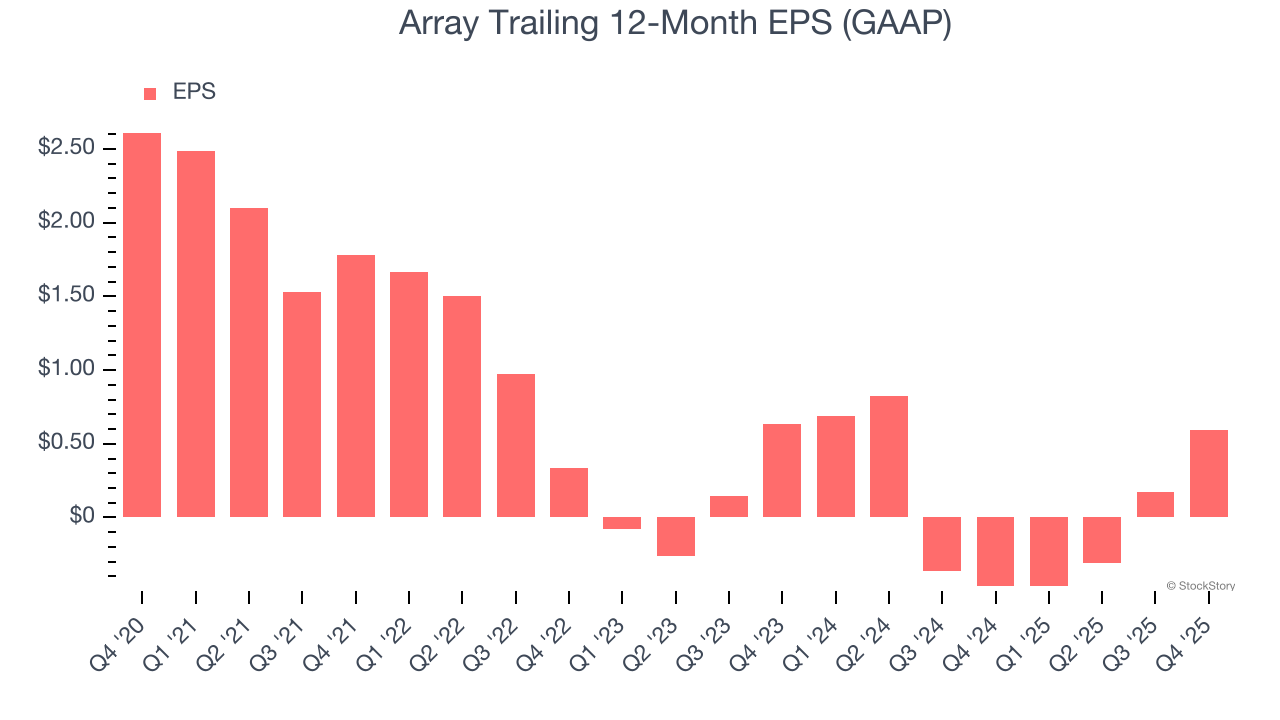
Sadly for Array, its EPS declined by 25.6% annually over the last five years, more than its revenue. We can see the difference stemmed from higher interest expenses or taxes as the company actually improved its operating margin and repurchased its shares during this time.
We can take a deeper look into Array’s earnings to better understand the drivers of its performance. As we mentioned earlier, Array’s operating margin expanded this quarter but declined by 2.5 percentage points over the last five years. This was the most relevant factor (aside from the revenue impact) behind its lower earnings; interest expenses and taxes can also affect EPS but don’t tell us as much about a company’s fundamentals.
Like with revenue, we analyze EPS over a more recent period because it can provide insight into an emerging theme or development for the business.
Although it wasn’t great, Array’s two-year annual EPS declines of 3.4% topped its two-year revenue losses.
In Q4, Array reported EPS of $0.48, up from $0.06 in the same quarter last year. This print easily cleared analysts’ estimates, and shareholders should be content with the results. Over the next 12 months, Wall Street expects Array’s full-year EPS of $0.59 to grow 98.9%.
Key Takeaways from Array’s Q4 Results
It was good to see Array beat analysts’ EPS expectations this quarter. We were also excited its revenue outperformed Wall Street’s estimates by a wide margin. Zooming out, we think this was a good print with some key areas of upside. The stock remained flat at $50.50 immediately following the results.
Array put up rock-solid earnings, but one quarter doesn’t necessarily make the stock a buy. Let’s see if this is a good investment. If you’re making that decision, you should consider the bigger picture of valuation, business qualities, as well as the latest earnings. We cover that in our actionable full research report which you can read here (it’s free).


