


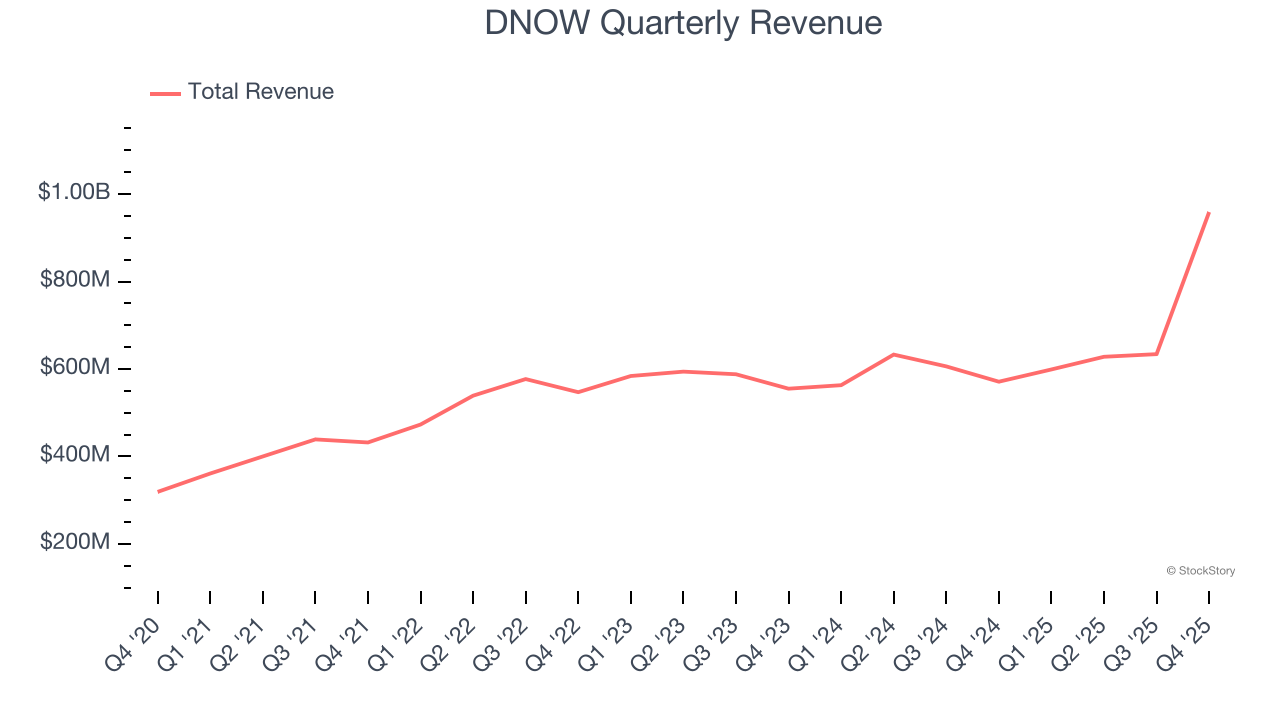
Energy and industrial distributor DNOW (NYSE: DNOW) fell short of the market’s revenue expectations in Q4 CY2025, but sales rose 68% year on year to $959 million. Its GAAP loss of $0.95 per share was significantly below analysts’ consensus estimates.
Is now the time to buy DNOW? Find out by accessing our full research report, it’s free.
DNOW (DNOW) Q4 CY2025 Highlights:
- On November 6, 2025, DNOW completed its acquisition of MRC Global in an all-stock transaction. This is why revenue, revenue growth, and shares outstanding below all show unusual increases
- Revenue: $959 million vs analyst estimates of $985.6 million (68% year-on-year growth, 2.7% miss)
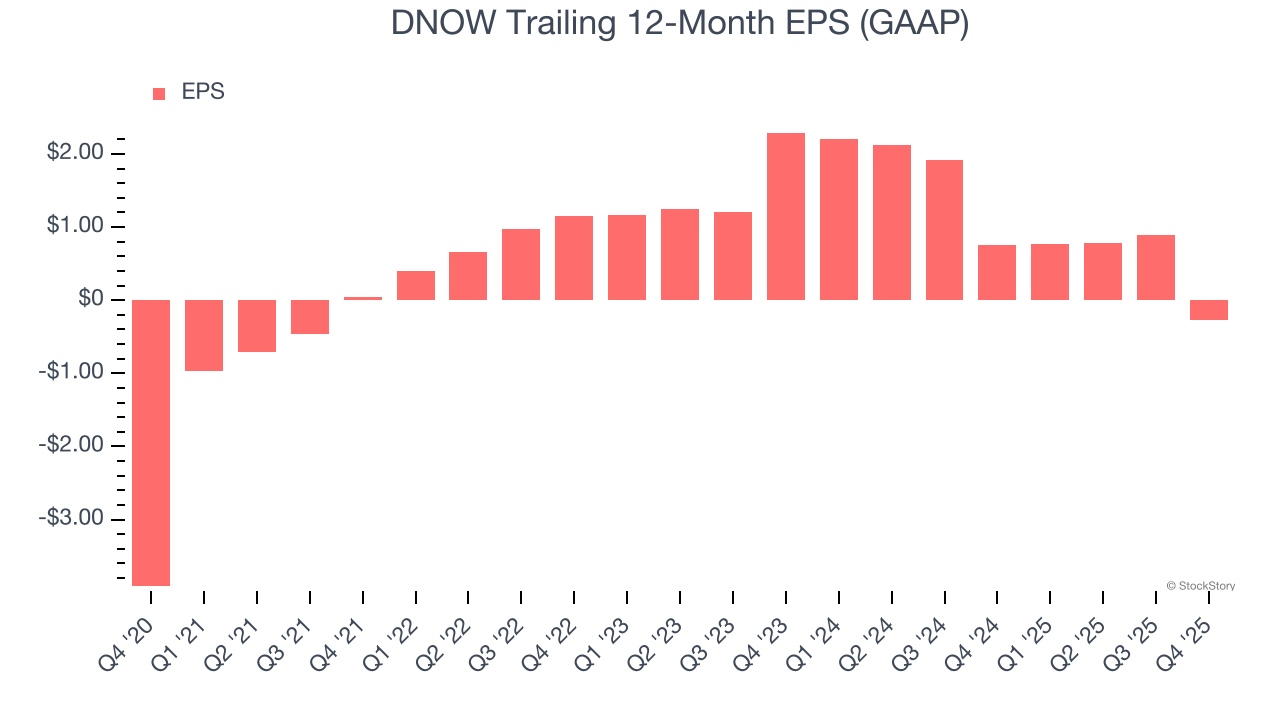
- EPS (GAAP): -$0.95 vs analyst estimates of $0.15 (significant miss)
- Adjusted EBITDA: $61 million vs analyst estimates of $68.7 million (6.4% margin, 11.2% miss)
- Operating Margin: -17.7%, down from 5.1% in the same quarter last year
- Market Capitalization: $3.04 billion
Company Overview
Spun off from National Oilwell Varco, DNOW (NYSE: DNOW) provides distribution and supply chain solutions for the energy and industrial end markets.
Revenue Growth
A company’s long-term sales performance can indicate its overall quality. Even a bad business can shine for one or two quarters, but a top-tier one grows for years. Luckily, DNOW’s sales grew at an impressive 11.7% compounded annual growth rate over the last five years. Its growth beat the average industrials company and shows its offerings resonate with customers.
We at StockStory place the most emphasis on long-term growth, but within industrials, a half-decade historical view may miss cycles, industry trends, or a company capitalizing on catalysts such as a new contract win or a successful product line. DNOW’s annualized revenue growth of 10.2% over the last two years is below its five-year trend, but we still think the results suggest healthy demand. 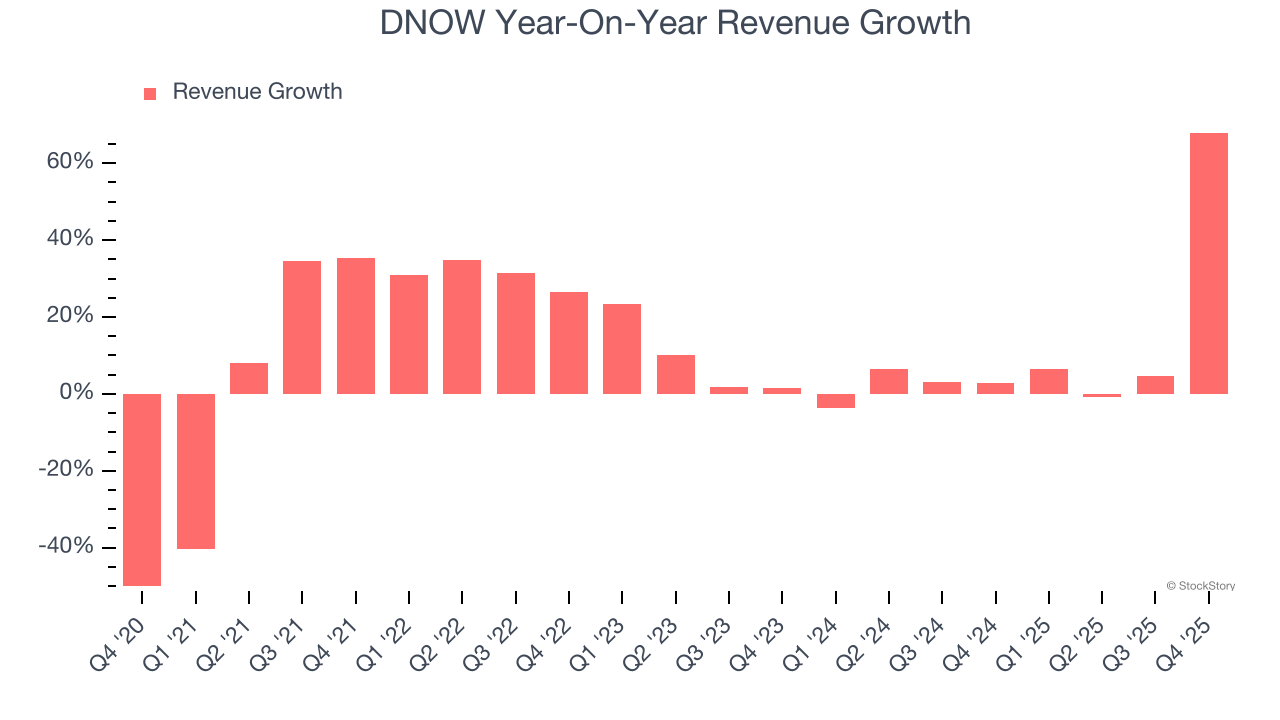
This quarter, DNOW achieved a magnificent 68% year-on-year revenue growth rate, but its $959 million of revenue fell short of Wall Street’s lofty estimates.
Looking ahead, sell-side analysts expect revenue to grow 90.7% over the next 12 months, an improvement versus the last two years. This projection is eye-popping and implies its newer products and services will spur better top-line performance.
Software is eating the world and there is virtually no industry left that has been untouched by it. That drives increasing demand for tools helping software developers do their jobs, whether it be monitoring critical cloud infrastructure, integrating audio and video functionality, or ensuring smooth content streaming. Click here to access a free report on our 3 favorite stocks to play this generational megatrend.
Operating Margin
DNOW was profitable over the last five years but held back by its large cost base. Its average operating margin of 2.8% was weak for an industrials business. This result isn’t too surprising given its low gross margin as a starting point.
Looking at the trend in its profitability, DNOW’s operating margin decreased by 3.2 percentage points over the last five years. This raises questions about the company’s expense base because its revenue growth should have given it leverage on its fixed costs, resulting in better economies of scale and profitability. DNOW’s performance was poor no matter how you look at it - it shows that costs were rising and it couldn’t pass them onto its customers.
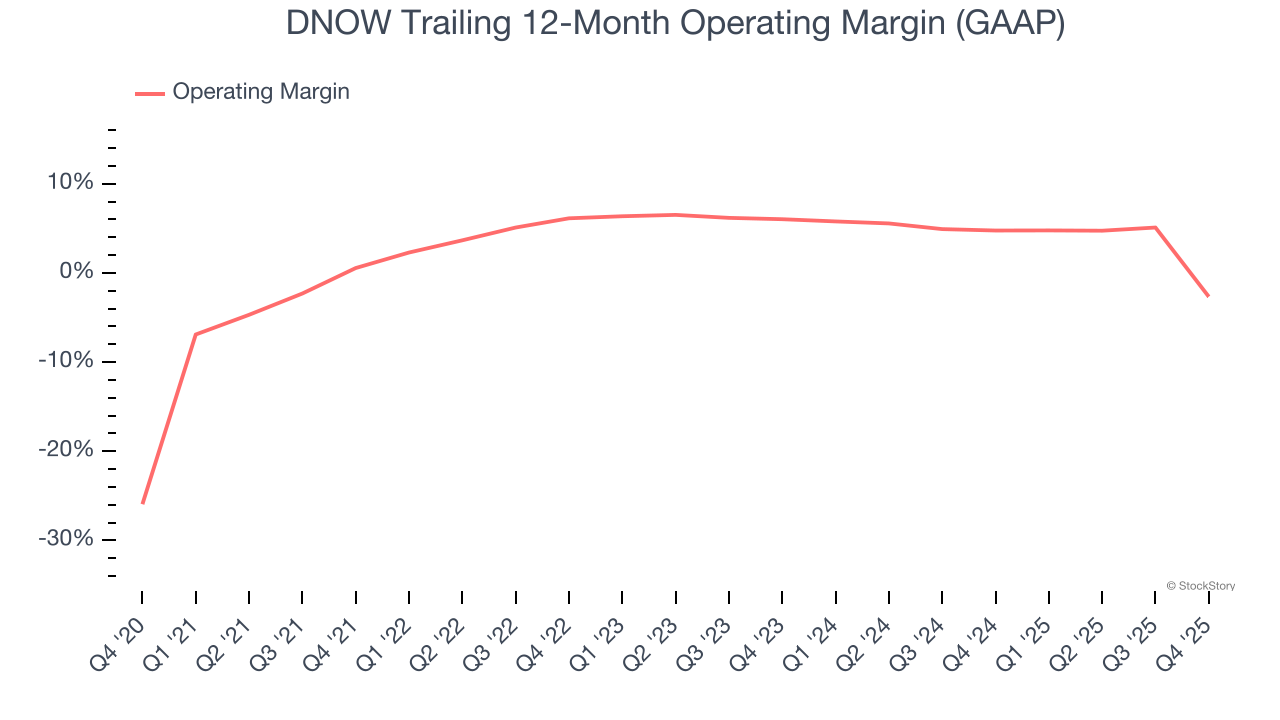
In Q4, DNOW generated an operating margin profit margin of negative 17.7%, down 22.8 percentage points year on year. Since DNOW’s operating margin decreased more than its gross margin, we can assume it was less efficient because expenses such as marketing, R&D, and administrative overhead increased.
Earnings Per Share
We track the long-term change in earnings per share (EPS) for the same reason as long-term revenue growth. Compared to revenue, however, EPS highlights whether a company’s growth is profitable.
Although DNOW’s full-year earnings are still negative, it reduced its losses and improved its EPS by 41.3% annually over the last five years. The next few quarters will be critical for assessing its long-term profitability.
Like with revenue, we analyze EPS over a shorter period to see if we are missing a change in the business.
Sadly for DNOW, its EPS declined by 45.6% annually over the last two years while its revenue grew by 10.2%. This tells us the company became less profitable on a per-share basis as it expanded.
We can take a deeper look into DNOW’s earnings to better understand the drivers of its performance. DNOW’s operating margin has declined over the last two yearswhile its share count has grown 44.9%. This means the company not only became less efficient with its operating expenses but also diluted its shareholders. 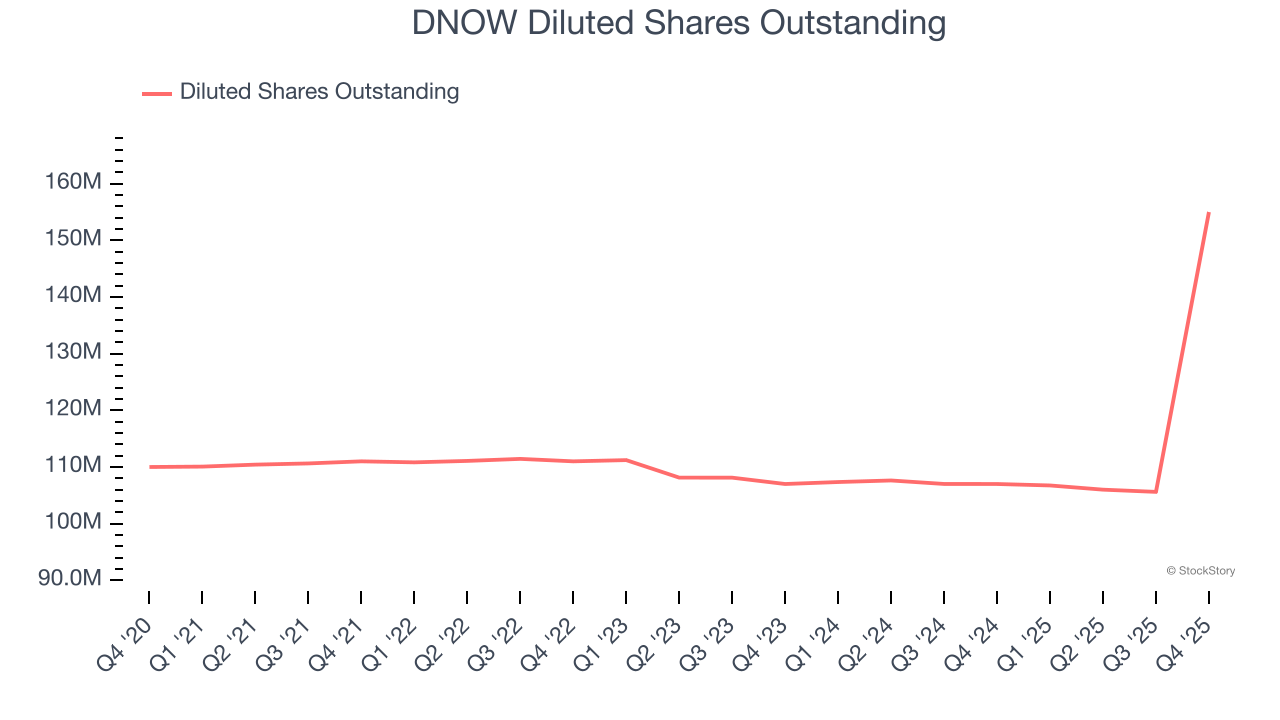
In Q4, DNOW reported EPS of negative $0.95, down from $0.21 in the same quarter last year. This print missed analysts’ estimates. We also like to analyze expected EPS growth based on Wall Street analysts’ consensus projections, but there is insufficient data.
Key Takeaways from DNOW’s Q4 Results
We struggled to find many positives in these results. Its revenue missed and its EBITDA fell short of Wall Street’s estimates. Overall, this was a softer quarter. The stock remained flat at $16.52 immediately after reporting.
Is DNOW an attractive investment opportunity right now? If you’re making that decision, you should consider the bigger picture of valuation, business qualities, as well as the latest earnings. We cover that in our actionable full research report which you can read here (it’s free).


