Luxury casino and resort operator Monarch (NASDAQ: MCRI) met Wall Street’s revenue expectations in Q4 CY2025, with sales up 4.1% year on year to $140 million. Its GAAP profit of $1.25 per share was 8.9% below analysts’ consensus estimates.
Is now the time to buy Monarch? Find out by accessing our full research report, it’s free.
Monarch (MCRI) Q4 CY2025 Highlights:
- Revenue: $140 million vs analyst estimates of $139.4 million (4.1% year-on-year growth, in line)
- EPS (GAAP): $1.25 vs analyst expectations of $1.37 (8.9% miss)
- Adjusted EBITDA: $51.81 million vs analyst estimates of $48.95 million (37% margin, 5.8% beat)
- Operating Margin: 20.8%, up from 7.6% in the same quarter last year
- Market Capitalization: $1.71 billion
CEO CommentJohn Farahi, Co-Chairman and Chief Executive Officer of Monarch, commented: “With all-time high fourth quarter financial results, we delivered another record year in 2025. Fourth quarter net revenue and adjusted EBITDA increased year-over-year by 4.1% and 9.6%, respectively. Fourth quarter adjusted EBITDA margin increased by approximately 185 basis points from 35.1% in the fourth quarter of 2024 to a record fourth quarter margin of 37.0%. Full year 2025 adjusted EBITDA margin increased by approximately 197 basis points from 34.5% in 2024 to a record 36.5% in 2025.
Company Overview
Established in 1993, Monarch (NASDAQ: MCRI) operates luxury casinos and resorts, offering high-end gaming, dining, and hospitality experiences.
Revenue Growth
A company’s long-term performance is an indicator of its overall quality. Any business can experience short-term success, but top-performing ones enjoy sustained growth for years. Over the last five years, Monarch grew its sales at a 24.2% annual rate. Although this growth is acceptable on an absolute basis, it fell slightly short of our standards for the consumer discretionary sector, which enjoys a number of secular tailwinds.
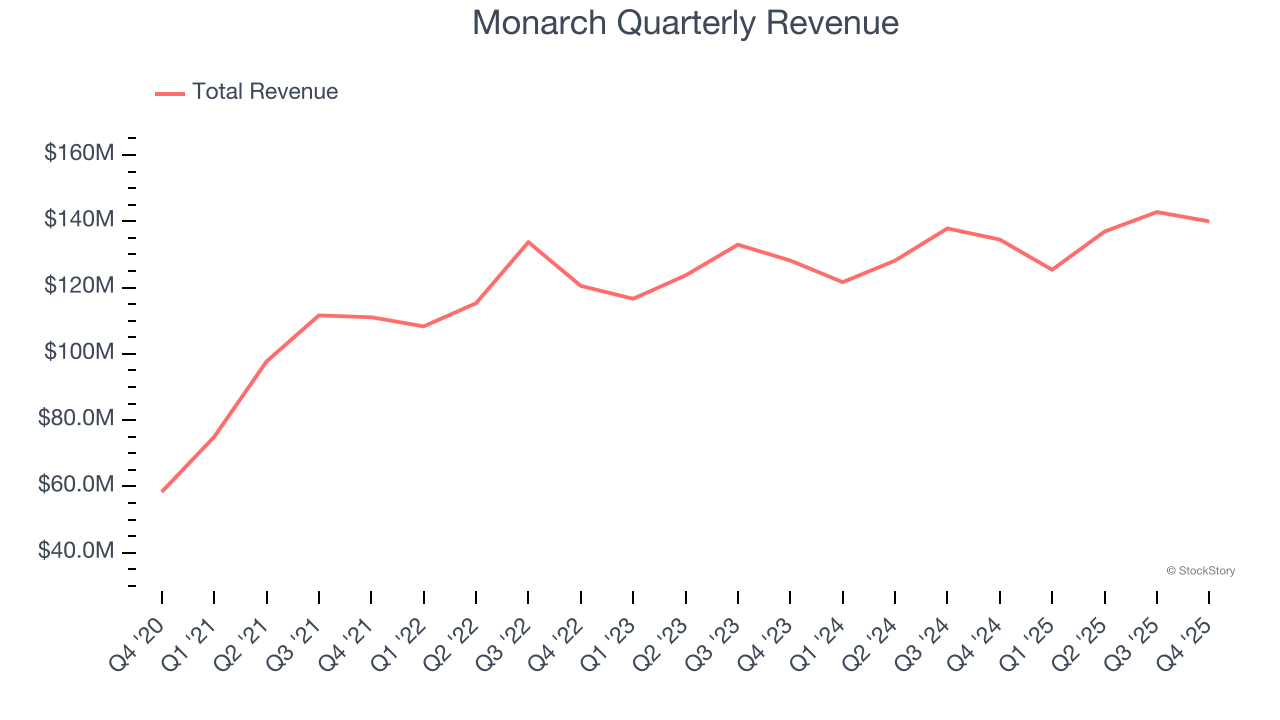
Long-term growth is the most important, but within consumer discretionary, product cycles are short and revenue can be hit-driven due to rapidly changing trends and consumer preferences. Monarch’s recent performance shows its demand has slowed as its annualized revenue growth of 4.3% over the last two years was below its five-year trend. Note that COVID hurt Monarch’s business in 2020 and part of 2021, and it bounced back in a big way thereafter. 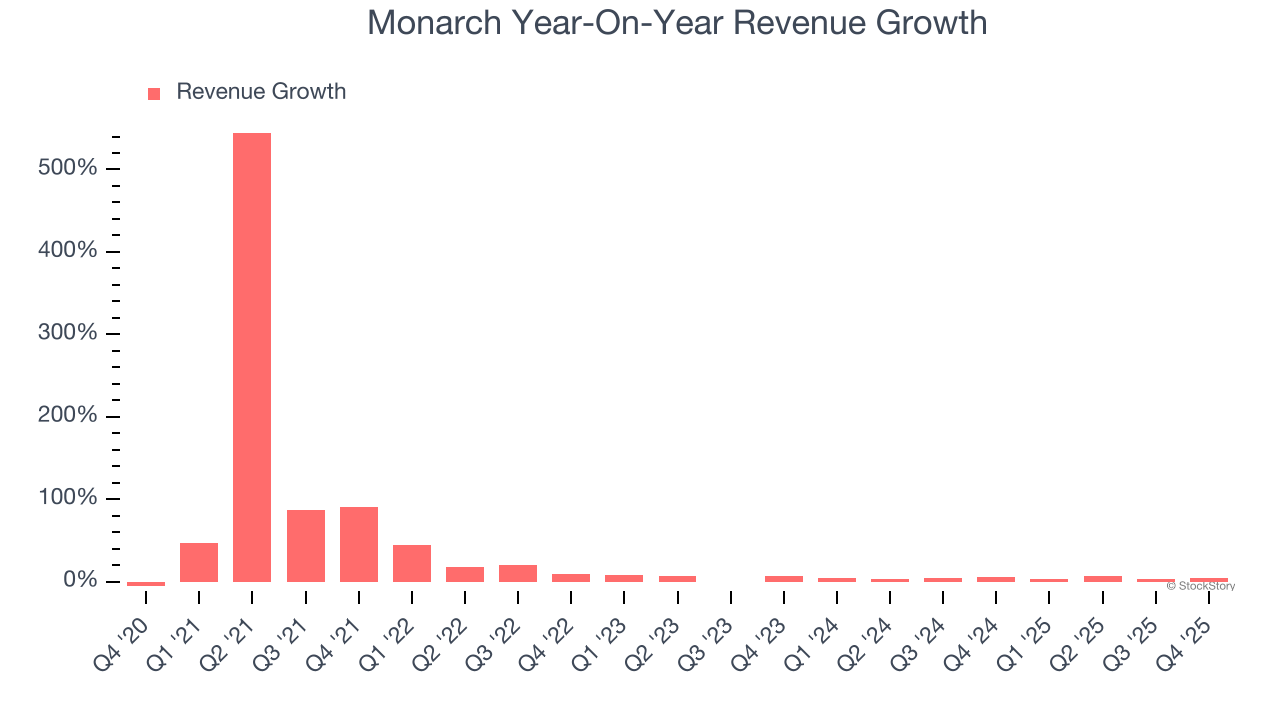
We can dig further into the company’s revenue dynamics by analyzing its three most important segments: Casino, Dining, and Hotel, which are 58%, 24.4%, and 12.8% of revenue. Over the last two years, Monarch’s revenues in all three segments increased. Its Casino revenue (Poker, Blackjack) averaged year-on-year growth of 5.5% while its Dining (food and beverage) and Hotel (overnight stays) revenues averaged 1.4% and 3.7%. 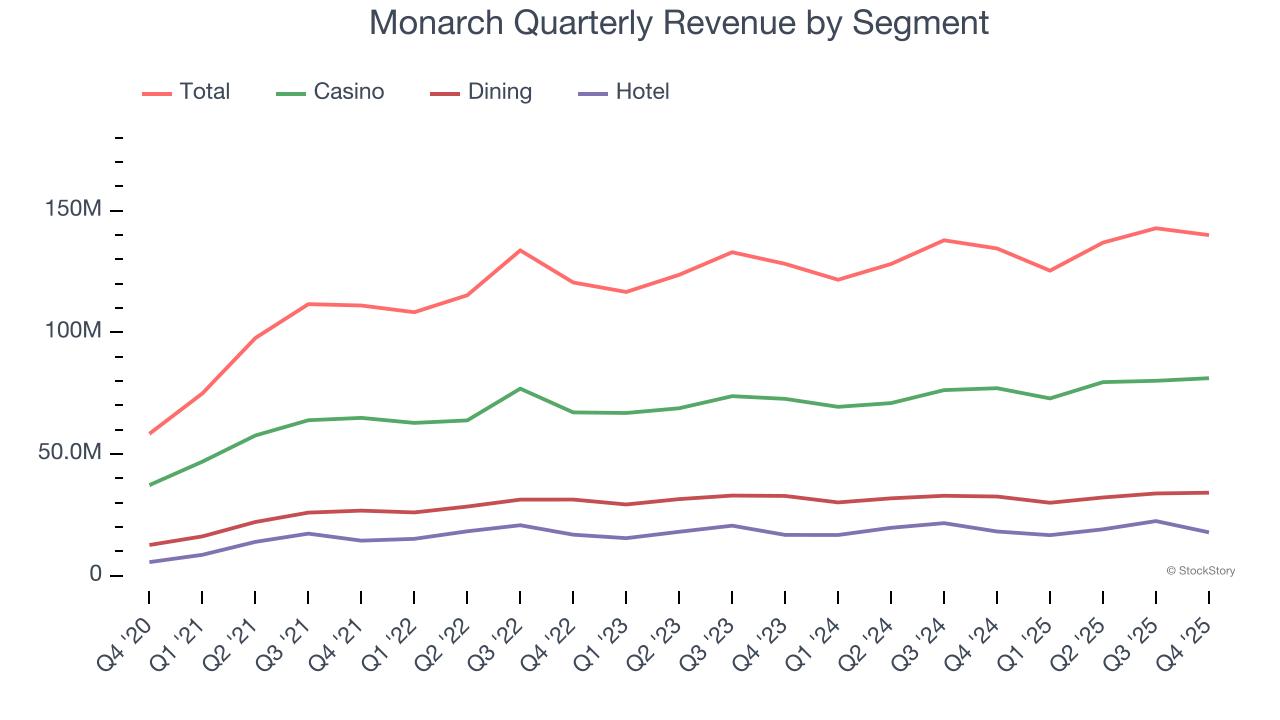
This quarter, Monarch grew its revenue by 4.1% year on year, and its $140 million of revenue was in line with Wall Street’s estimates.
Looking ahead, sell-side analysts expect revenue to grow 3.5% over the next 12 months, similar to its two-year rate. This projection is underwhelming and indicates its newer products and services will not accelerate its top-line performance yet.
While Wall Street chases Nvidia at all-time highs, an under-the-radar semiconductor supplier is dominating a critical AI component these giants can’t build without. Click here to access our free report one of our favorites growth stories.
Operating Margin
Operating margin is a key measure of profitability. Think of it as net income - the bottom line - excluding the impact of taxes and interest on debt, which are less connected to business fundamentals.
Monarch’s operating margin has risen over the last 12 months and averaged 21.2% over the last two years. The company’s higher efficiency is a breath of fresh air, but its suboptimal cost structure means it still sports lousy profitability for a consumer discretionary business.
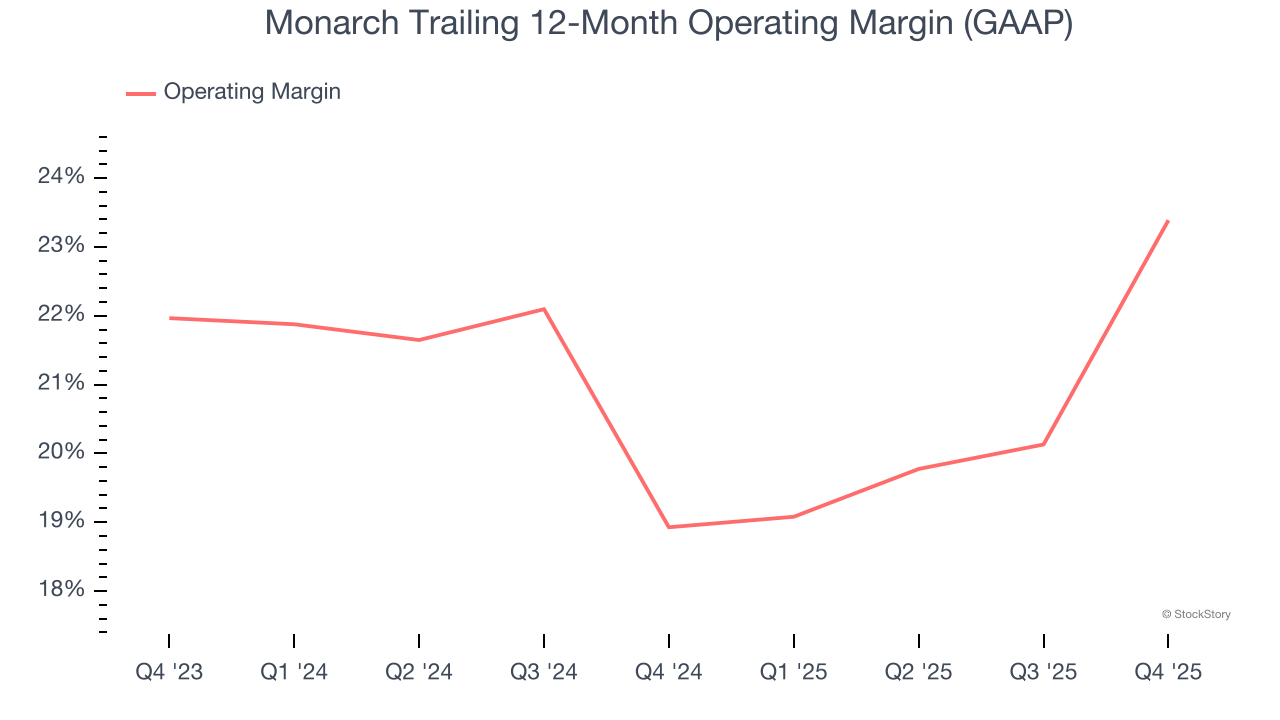
In Q4, Monarch generated an operating margin profit margin of 20.8%, up 13.2 percentage points year on year. This increase was a welcome development and shows it was more efficient.
Earnings Per Share
We track the long-term change in earnings per share (EPS) for the same reason as long-term revenue growth. Compared to revenue, however, EPS highlights whether a company’s growth is profitable.
Monarch’s EPS grew at a decent 34.4% compounded annual growth rate over the last five years, higher than its 24.2% annualized revenue growth. This tells us the company became more profitable on a per-share basis as it expanded.
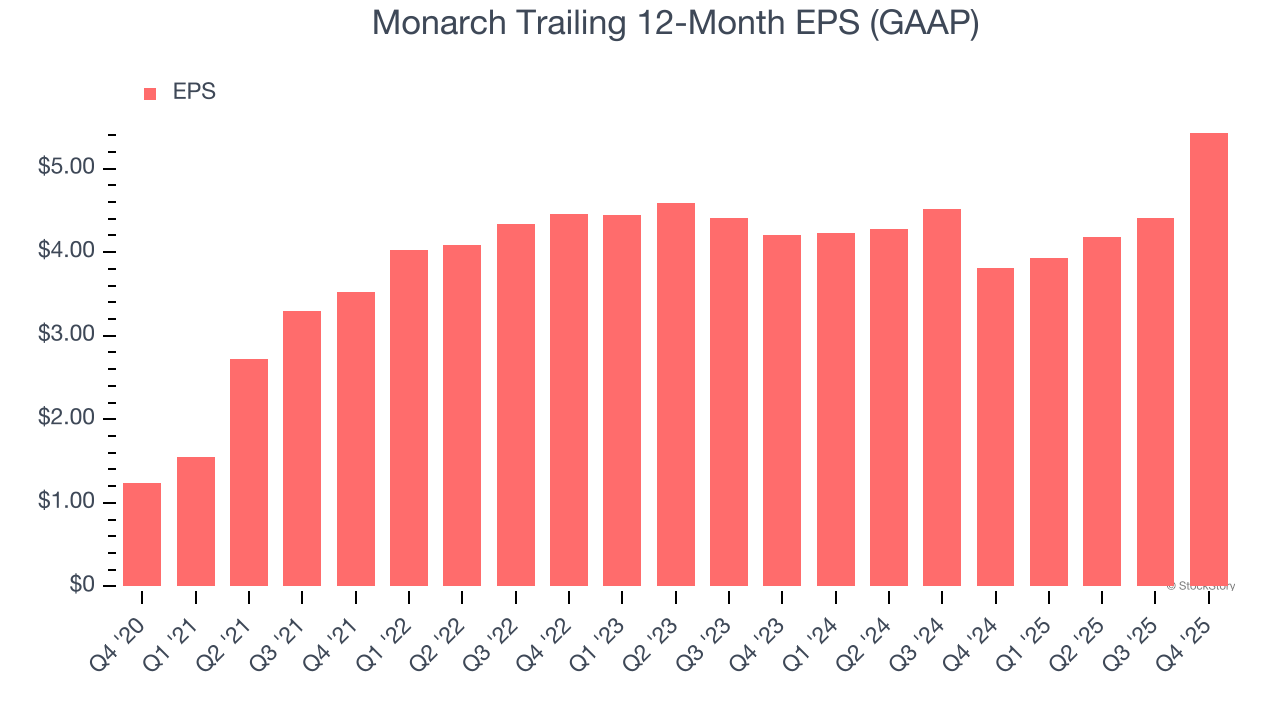
In Q4, Monarch reported EPS of $1.25, up from $0.22 in the same quarter last year. Despite growing year on year, this print missed analysts’ estimates, but we care more about long-term EPS growth than short-term movements. Over the next 12 months, Wall Street expects Monarch’s full-year EPS of $5.43 to grow 5.2%.
Key Takeaways from Monarch’s Q4 Results
It was encouraging to see Monarch beat analysts’ EBITDA expectations this quarter. On the other hand, its Hotel revenue missed and its EPS fell short of Wall Street’s estimates. Overall, this was a weaker quarter. The stock remained flat at $93.25 immediately after reporting.
Is Monarch an attractive investment opportunity at the current price? We think that the latest quarter is only one piece of the longer-term business quality puzzle. Quality, when combined with valuation, can help determine if the stock is a buy. We cover that in our actionable full research report which you can read here (it’s free).