
Insurance services company CNO Financial Group (NYSE: CNO) reported Q4 CY2025 results beating Wall Street’s revenue expectations, with sales up 15.5% year on year to $1.14 billion. Its GAAP profit of $0.95 per share was 16.8% below analysts’ consensus estimates.
Is now the time to buy CNO Financial Group? Find out by accessing our full research report, it’s free.
CNO Financial Group (CNO) Q4 CY2025 Highlights:
- Net Premiums Earned: $662.2 million (2.9% year-on-year growth)
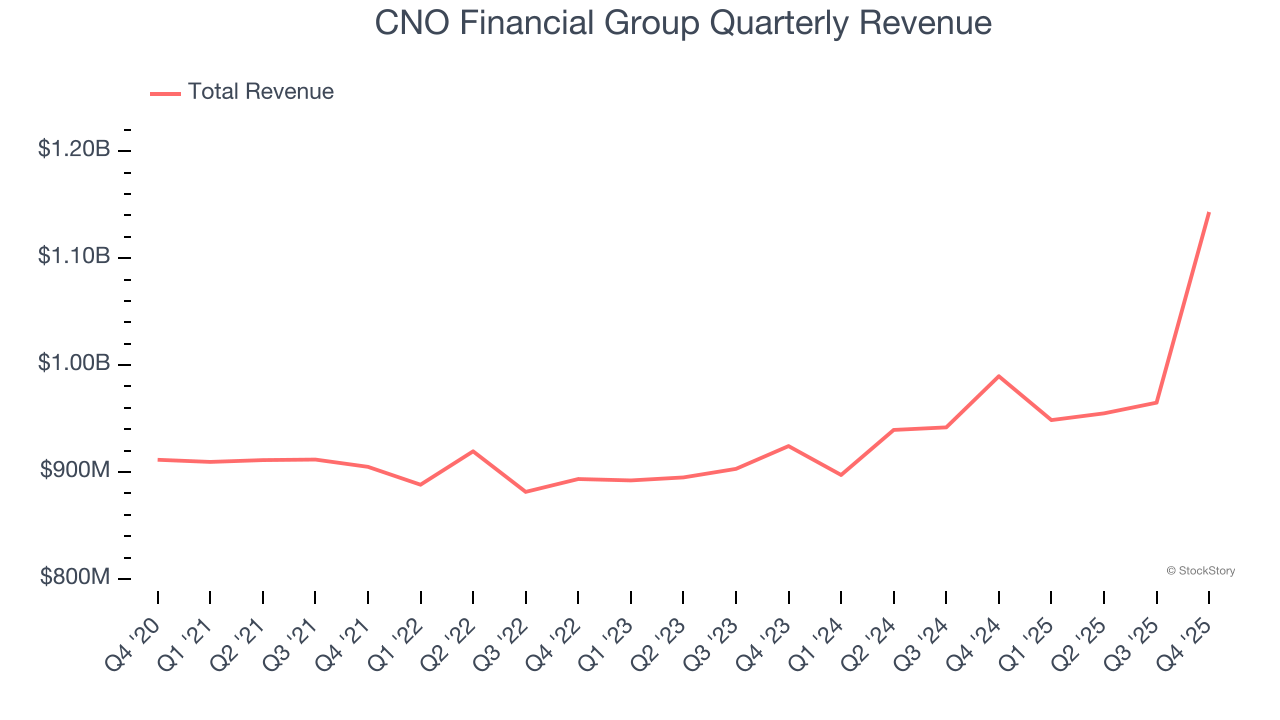
- Revenue: $1.14 billion vs analyst estimates of $998.4 million (15.5% year-on-year growth, 14.5% beat)
- Pre-tax Profit: $111.4 million (9.7% margin)
- EPS (GAAP): $0.95 vs analyst expectations of $1.14 (16.8% miss)
- Book Value per Share: $27.92 vs analyst estimates of $39.83 (13.6% year-on-year growth, 29.9% miss)
- Market Capitalization: $4.06 billion
"CNO once again delivered an excellent quarter and full-year performance, demonstrating the consistent, repeatable results that continue to drive our momentum," said Gary C. Bhojwani, chief executive officer.
Company Overview
Rebranded from Conseco in 2010 to signal a fresh start after navigating financial challenges, CNO Financial Group (NYSE: CNO) develops and markets health insurance, annuities, and life insurance products primarily targeting middle-income pre-retirees and retirees.
Revenue Growth
Insurance companies earn revenue from three primary sources: 1) The core insurance business itself, often called underwriting and represented in the income statement as premiums 2) Income from investing the “float” (premiums collected upfront not yet paid out as claims) in assets such as fixed-income assets and equities 3) Fees from various sources such as policy administration, annuities, or other value-added services. Over the last five years, CNO Financial Group grew its revenue at a sluggish 2.3% compounded annual growth rate. This fell short of our benchmarks and is a rough starting point for our analysis.
Long-term growth is the most important, but within financials, a half-decade historical view may miss recent interest rate changes and market returns. CNO Financial Group’s annualized revenue growth of 5.3% over the last two years is above its five-year trend, but we were still disappointed by the results. 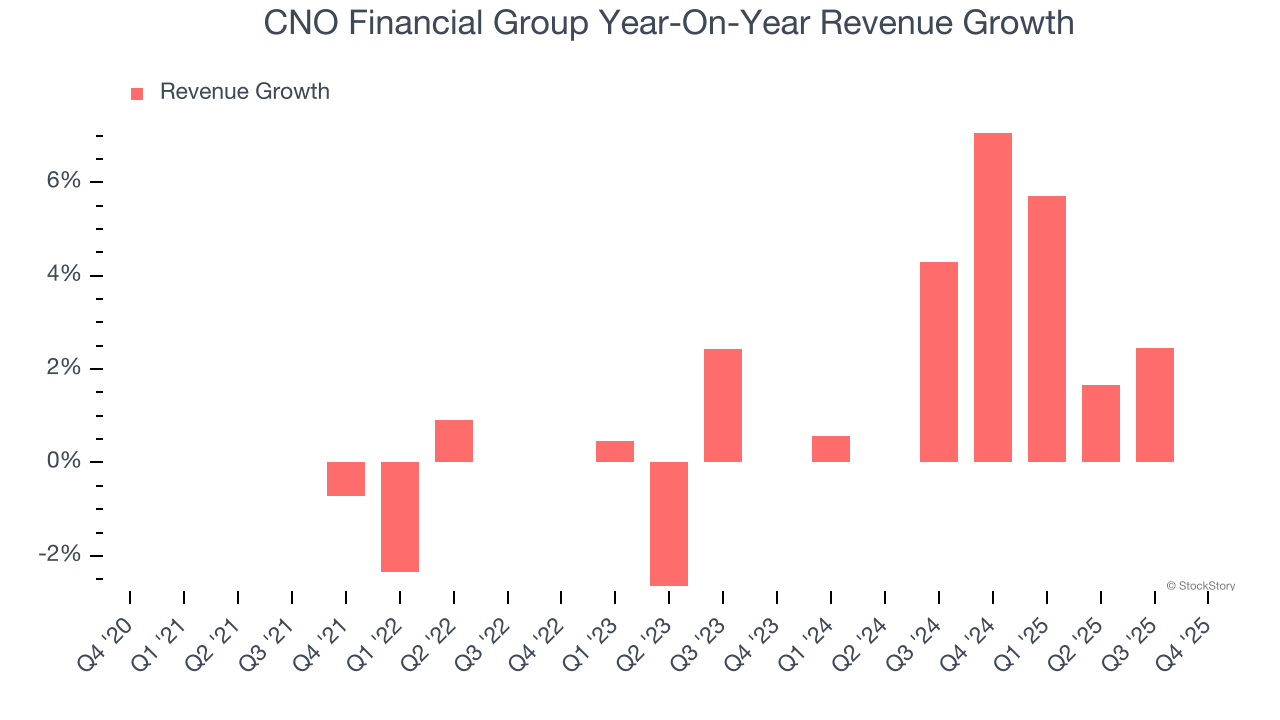 Note: Quarters not shown were determined to be outliers, impacted by outsized investment gains/losses that are not indicative of the recurring fundamentals of the business.
This quarter, CNO Financial Group reported year-on-year revenue growth of 15.5%, and its $1.14 billion of revenue exceeded Wall Street’s estimates by 14.5%.
Net premiums earned made up 68.3% of the company’s total revenue during the last five years, meaning insurance operations are CNO Financial Group’s largest source of revenue.
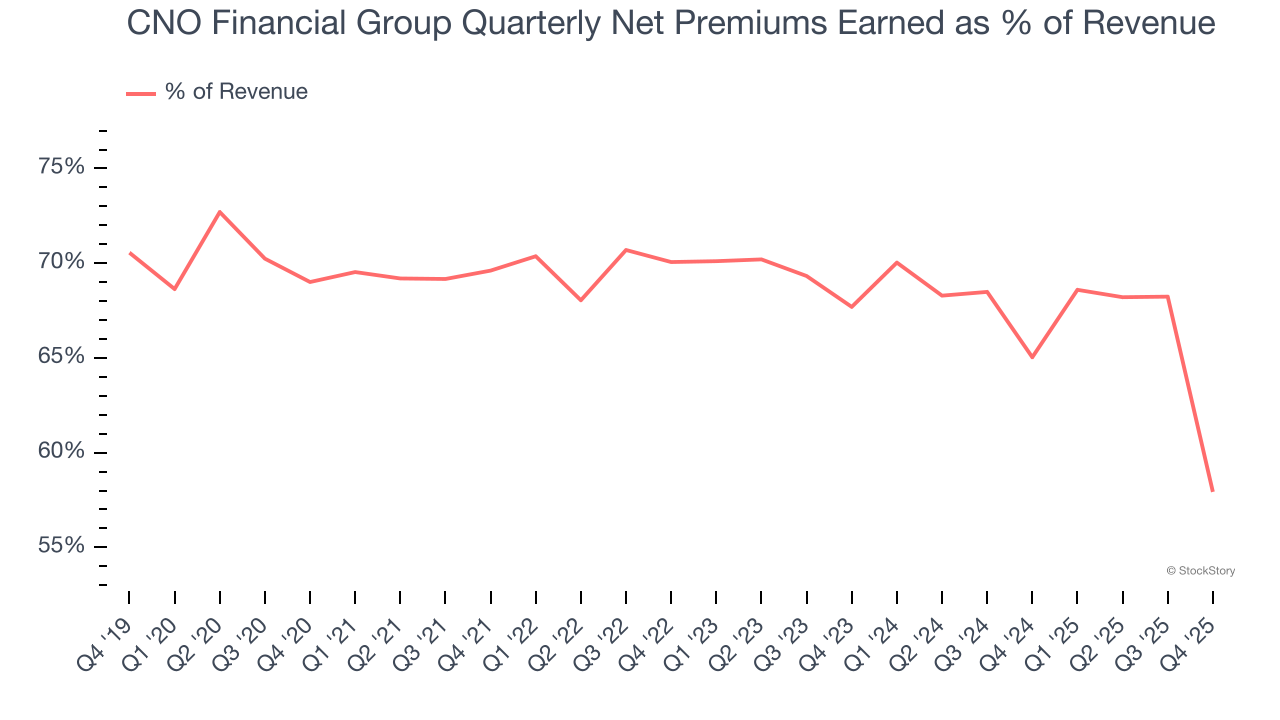
Net premiums earned commands greater market attention due to its reliability and consistency, whereas investment and fee income are often seen as more volatile revenue streams that fluctuate with market conditions.
While Wall Street chases Nvidia at all-time highs, an under-the-radar semiconductor supplier is dominating a critical AI component these giants can’t build without. Click here to access our free report one of our favorites growth stories.
Book Value Per Share (BVPS)
Insurers are balance sheet businesses, collecting premiums upfront and paying out claims over time. Premiums collected but not yet paid out, often referred to as the float, are invested and create an asset base supported by a liability structure. Book value per share (BVPS) captures this dynamic by measuring these assets (investment portfolio, cash, reinsurance recoverables) less liabilities (claim reserves, debt, future policy benefits). BVPS is essentially the residual value for shareholders.
We therefore consider BVPS very important to track for insurers and a metric that sheds light on business quality. While other (and more commonly known) per-share metrics like EPS can sometimes be lumpy due to reserve releases or one-time items and can be managed or skewed while still following accounting rules, BVPS reflects long-term capital growth and is harder to manipulate.
CNO Financial Group’s BVPS declined at a 7.2% annual clip over the last five years. However, BVPS growth has accelerated recently, growing by 17.4% annually over the last two years from $20.26 to $27.92 per share.
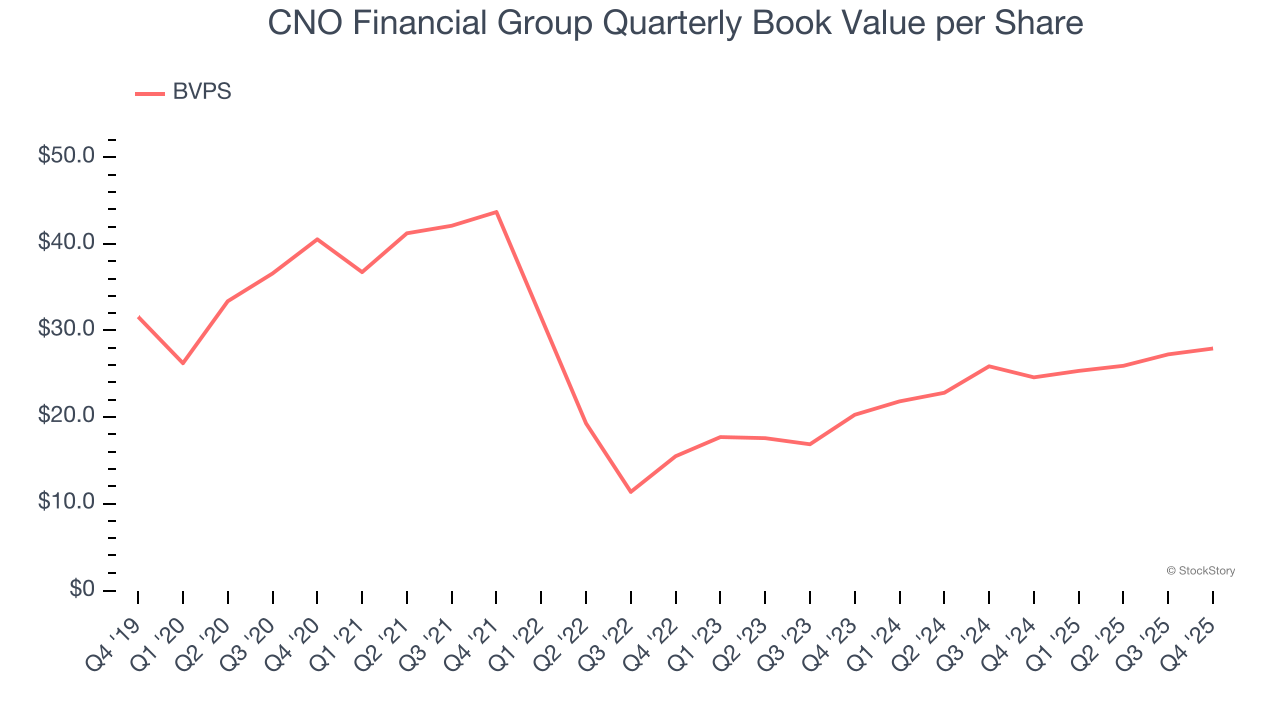
Over the next 12 months, Consensus estimates call for CNO Financial Group’s BVPS to grow by 54.7% to $39.83, elite growth rate.
Key Takeaways from CNO Financial Group’s Q4 Results
We were impressed by how significantly CNO Financial Group blew past analysts’ revenue expectations this quarter. On the other hand, its EPS missed and its book value per share fell short of Wall Street’s estimates. Overall, this was a softer quarter. The stock traded up 2% to $43.16 immediately following the results.
So do we think CNO Financial Group is an attractive buy at the current price? If you’re making that decision, you should consider the bigger picture of valuation, business qualities, as well as the latest earnings. We cover that in our actionable full research report which you can read here (it’s free).