Financial software provider SS&C Technologies (NASDAQ: SSNC) announced better-than-expected revenue in Q4 CY2025, with sales up 8% year on year to $1.65 billion. Guidance for next quarter’s revenue was better than expected at $1.63 billion at the midpoint, 0.9% above analysts’ estimates. Its non-GAAP profit of $1.69 per share was 5% above analysts’ consensus estimates.
Is now the time to buy SS&C? Find out by accessing our full research report, it’s free.
SS&C (SSNC) Q4 CY2025 Highlights:
- Revenue: $1.65 billion vs analyst estimates of $1.62 billion (8% year-on-year growth, 1.8% beat)
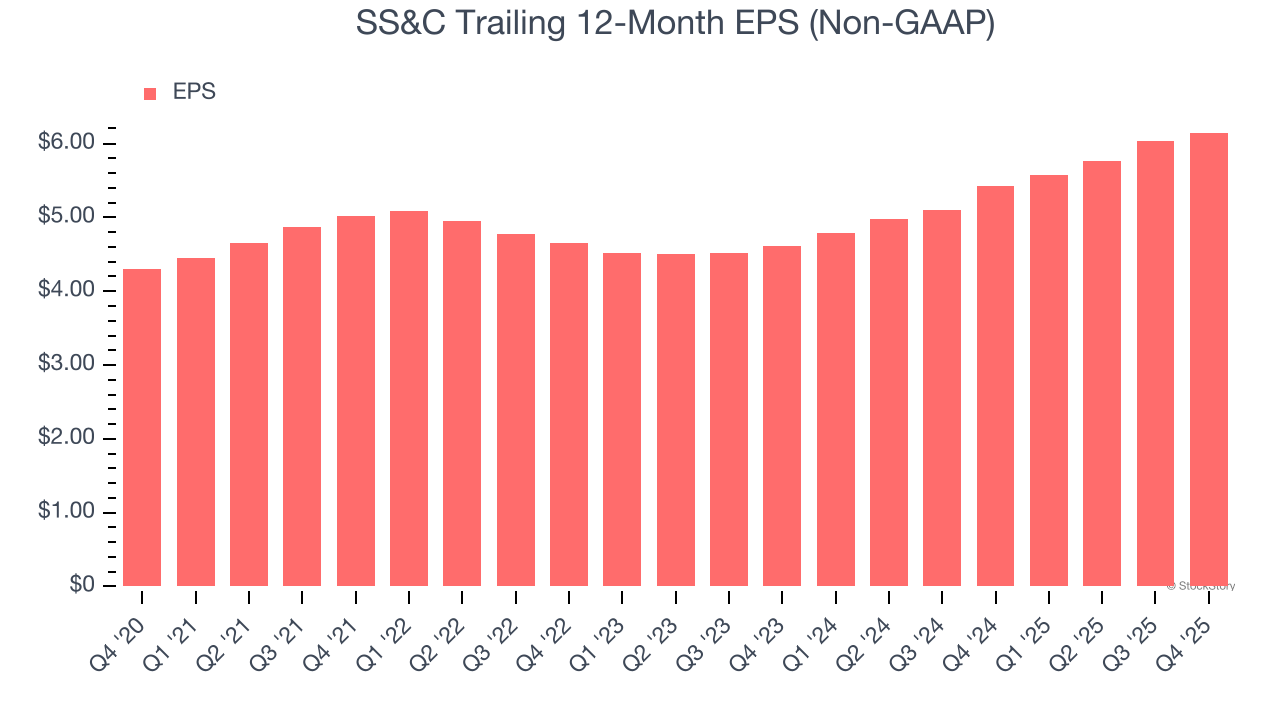
- Adjusted EPS: $1.69 vs analyst estimates of $1.61 (5% beat)
- Adjusted EBITDA: $651.8 million vs analyst estimates of $653.4 million (39.4% margin, in line)
- Revenue Guidance for Q1 CY2026 is $1.63 billion at the midpoint, above analyst estimates of $1.61 billion
- Adjusted EPS guidance for the upcoming financial year 2026 is $6.86 at the midpoint, beating analyst estimates by 3.9%
- Operating Margin: 22.3%, down from 23.4% in the same quarter last year
- Free Cash Flow Margin: 38.3%, up from 27.6% in the same quarter last year
- Market Capitalization: $17.98 billion
“SS&C’s 2025 performance reflects exceptional execution and the depth and breadth of our product and service portfolio. This quarter, we delivered record adjusted revenues of $1,655 million and adjusted consolidated EBITDA of $651 million, setting us up for a strong 2026,” says Bill Stone, Chairman and Chief Executive Officer.
Company Overview
Founded in 1986 as a bridge between technology and financial services, SS&C Technologies (NASDAQ: SSNC) provides software and software-enabled services that help financial firms and healthcare organizations automate complex business processes.
Revenue Growth
Reviewing a company’s long-term sales performance reveals insights into its quality. Even a bad business can shine for one or two quarters, but a top-tier one grows for years.
With $6.28 billion in revenue over the past 12 months, SS&C is one of the larger companies in the business services industry and benefits from a well-known brand that influences purchasing decisions.
As you can see below, SS&C’s 6% annualized revenue growth over the last five years was decent. This shows its offerings generated slightly more demand than the average business services company, a useful starting point for our analysis.
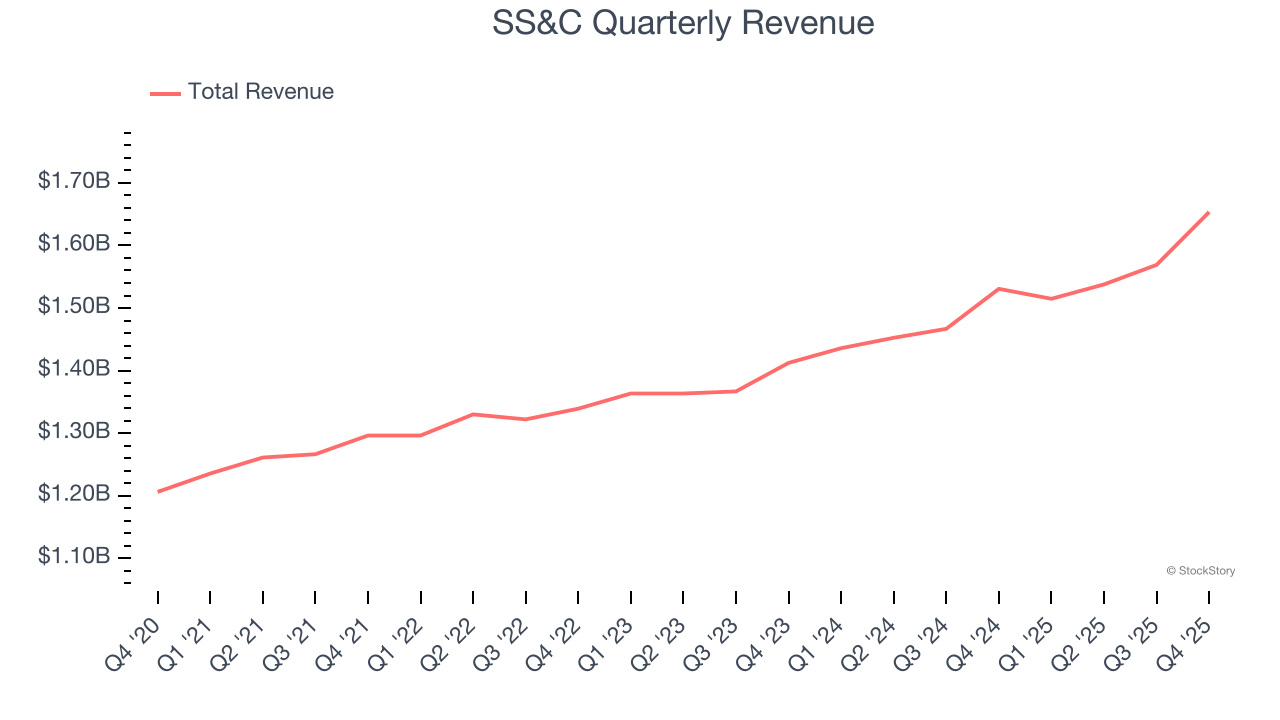
Long-term growth is the most important, but within business services, a half-decade historical view may miss new innovations or demand cycles. SS&C’s annualized revenue growth of 6.8% over the last two years aligns with its five-year trend, suggesting its demand was stable. 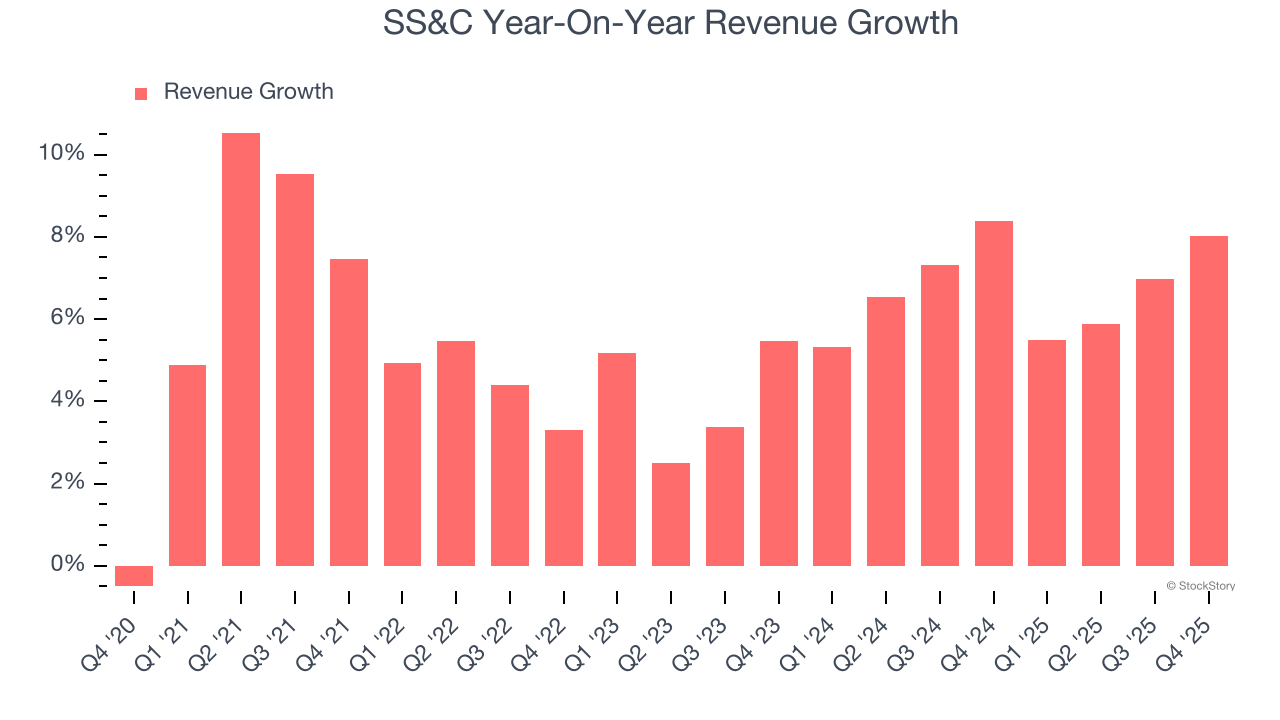
This quarter, SS&C reported year-on-year revenue growth of 8%, and its $1.65 billion of revenue exceeded Wall Street’s estimates by 1.8%. Company management is currently guiding for a 7.5% year-on-year increase in sales next quarter.
Looking further ahead, sell-side analysts expect revenue to grow 5.4% over the next 12 months, similar to its two-year rate. Despite the slowdown, this projection is above the sector average and indicates the market sees some success for its newer products and services.
Microsoft, Alphabet, Coca-Cola, Monster Beverage—all began as under-the-radar growth stories riding a massive trend. We’ve identified the next one: a profitable AI semiconductor play Wall Street is still overlooking. Go here for access to our full report.
Operating Margin
Operating margin is one of the best measures of profitability because it tells us how much money a company takes home after subtracting all core expenses, like marketing and R&D.
SS&C has been a well-oiled machine over the last five years. It demonstrated elite profitability for a business services business, boasting an average operating margin of 22.8%.
Looking at the trend in its profitability, SS&C’s operating margin decreased by 1.7 percentage points over the last five years. This raises questions about the company’s expense base because its revenue growth should have given it leverage on its fixed costs, resulting in better economies of scale and profitability.
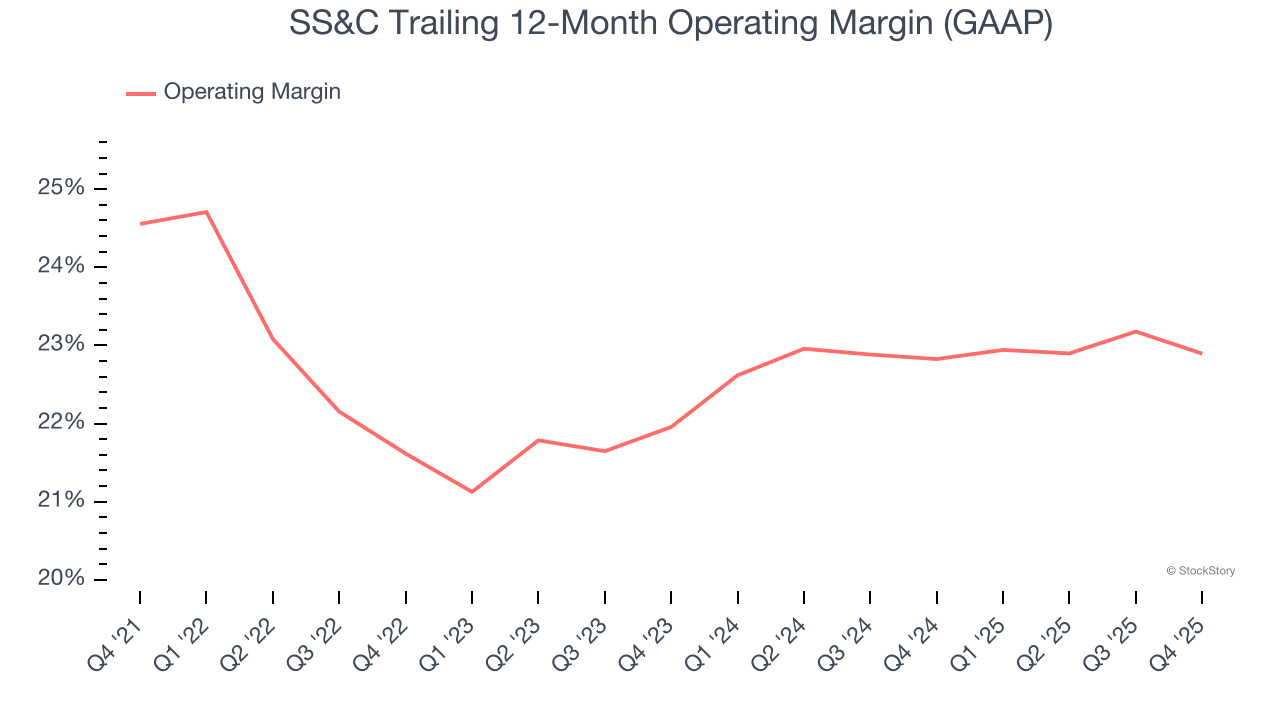
In Q4, SS&C generated an operating margin profit margin of 22.3%, down 1.1 percentage points year on year. This reduction is quite minuscule and indicates the company’s overall cost structure has been relatively stable.
Earnings Per Share
Revenue trends explain a company’s historical growth, but the long-term change in earnings per share (EPS) points to the profitability of that growth – for example, a company could inflate its sales through excessive spending on advertising and promotions.
SS&C’s unimpressive 7.4% annual EPS growth over the last five years aligns with its revenue performance. This tells us it maintained its per-share profitability as it expanded.
Like with revenue, we analyze EPS over a more recent period because it can provide insight into an emerging theme or development for the business.
For SS&C, its two-year annual EPS growth of 15.4% was higher than its five-year trend. This acceleration made it one of the faster-growing business services companies in recent history.
In Q4, SS&C reported adjusted EPS of $1.69, up from $1.58 in the same quarter last year. This print beat analysts’ estimates by 5%. Over the next 12 months, Wall Street expects SS&C’s full-year EPS of $6.15 to grow 8%.
Key Takeaways from SS&C’s Q4 Results
Revenue and EPS both beat, which is a good start. We enjoyed seeing SS&C beat analysts’ full-year EPS guidance expectations this quarter. We were also glad its full-year revenue guidance exceeded Wall Street’s estimates. Overall, we think this was a solid quarter with some key areas of upside. The stock remained flat at $74.89 immediately after reporting.
Big picture, is SS&C a buy here and now? We think that the latest quarter is only one piece of the longer-term business quality puzzle. Quality, when combined with valuation, can help determine if the stock is a buy. We cover that in our actionable full research report which you can read here (it’s free).